OPEN-SOURCE SCRIPT
EMA & SMA Stack
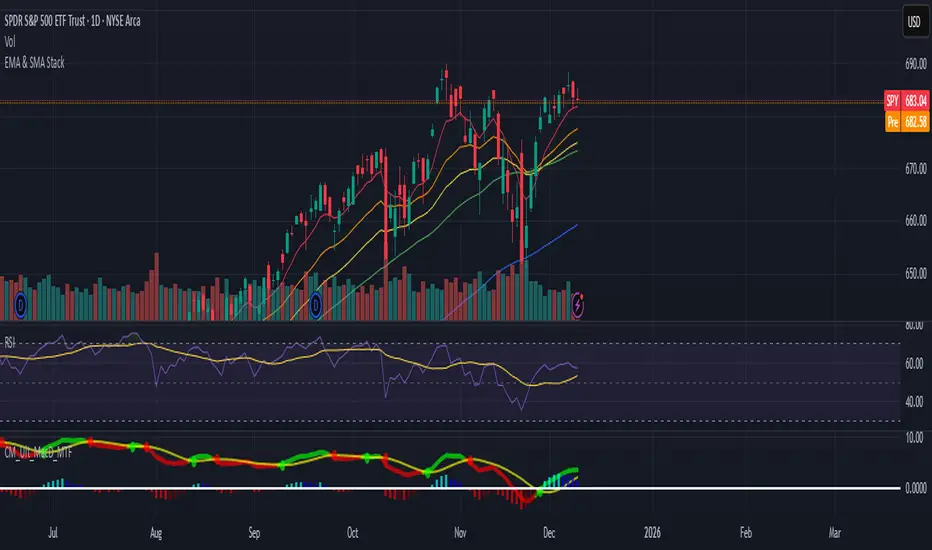
A clean, lightweight trend-structure tool that overlays six moving averages on price so you can instantly see direction, momentum, and trend health.
Includes
Default layout: 8 EMA (red), 21 EMA (orange), 34 EMA (yellow), 50 SMA (green), 100 SMA (blue), 200 SMA (purple)
How to use
Why it helps
This removes guesswork. You get immediate confirmation of trend direction, support and resistance, and momentum shift on any timeframe.
Minimal clutter. Maximum signal.
Includes
- 3 Exponential Moving Averages with adjustable lengths
- 3 Simple Moving Averages with adjustable lengths
- Thin, color-coded lines for fast visual clarity
Default layout: 8 EMA (red), 21 EMA (orange), 34 EMA (yellow), 50 SMA (green), 100 SMA (blue), 200 SMA (purple)
How to use
- When faster EMAs are above slower EMAs and price is above all lines, trend strength is bullish.
- When faster EMAs fall below slower SMAs and price is under all lines, trend strength is bearish.
- Tight stacking = compression and potential breakout zones.
- Wide separation = strong trend or exhaustion risk.
Why it helps
This removes guesswork. You get immediate confirmation of trend direction, support and resistance, and momentum shift on any timeframe.
Minimal clutter. Maximum signal.
開源腳本
秉持TradingView一貫精神,這個腳本的創作者將其設為開源,以便交易者檢視並驗證其功能。向作者致敬!您可以免費使用此腳本,但請注意,重新發佈代碼需遵守我們的社群規範。
免責聲明
這些資訊和出版物並非旨在提供,也不構成TradingView提供或認可的任何形式的財務、投資、交易或其他類型的建議或推薦。請閱讀使用條款以了解更多資訊。
開源腳本
秉持TradingView一貫精神,這個腳本的創作者將其設為開源,以便交易者檢視並驗證其功能。向作者致敬!您可以免費使用此腳本,但請注意,重新發佈代碼需遵守我們的社群規範。
免責聲明
這些資訊和出版物並非旨在提供,也不構成TradingView提供或認可的任何形式的財務、投資、交易或其他類型的建議或推薦。請閱讀使用條款以了解更多資訊。