PROTECTED SOURCE SCRIPT
已更新 GMS: The Gummy Worm
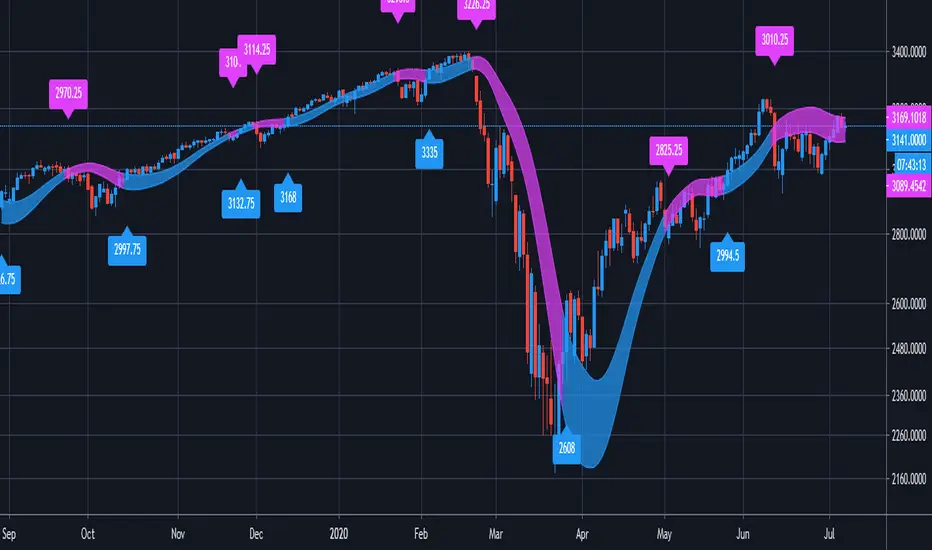
This will help to identify trends within markets on any time frame. It's based on moving averages thus you can select the moving average which you want to use and obviously it's length as well. The gummy worm will get a little fatter during times of higher volatility which helps avoid false signals.
The blue indicates an uptrend and pink indicates a downtrend. The dots you see mark the bar of which the trend flips. The trend flips the close of the bar. The indicator repaints on every tick so you will see it change colors when it is close to changing trend. Price needs to close above the upper part of the channel to flip up (blue) and conversely it needs to close below the lower part to flip down (pink).
I hope this helps!
Andre
發行說明
The Super Gummy Worm!- There are now price labels for the closing price of the bar that changes the color.
- For fans of bar charts, there is a bar color option, its automatically enabled so just disable it in the style settings if you don't want it.
- Remember to change the resolution to "same as symbol" the default is now Daily.
- There is a skinny worm selection as well. This just helps with identifying potential trend continuation points.
發行說明
Another quick update:- removed the word "Close: " from the labels since it ended up looking a little cluttered.
- expanded the offset range from -2 to 2.
Next Update:
- Picking your own label colors.
發行說明
Added in the Hull Moving Average.受保護腳本
此腳本以閉源形式發佈。 不過,您可以自由使用,沒有任何限制 — 點擊此處了解更多。
免責聲明
這些資訊和出版物並非旨在提供,也不構成TradingView提供或認可的任何形式的財務、投資、交易或其他類型的建議或推薦。請閱讀使用條款以了解更多資訊。
受保護腳本
此腳本以閉源形式發佈。 不過,您可以自由使用,沒有任何限制 — 點擊此處了解更多。
免責聲明
這些資訊和出版物並非旨在提供,也不構成TradingView提供或認可的任何形式的財務、投資、交易或其他類型的建議或推薦。請閱讀使用條款以了解更多資訊。