OPEN-SOURCE SCRIPT
已更新 Consensio V2 - Relativity Indicator

This indicator is based on Consensio Trading System by Tyler Jenks.
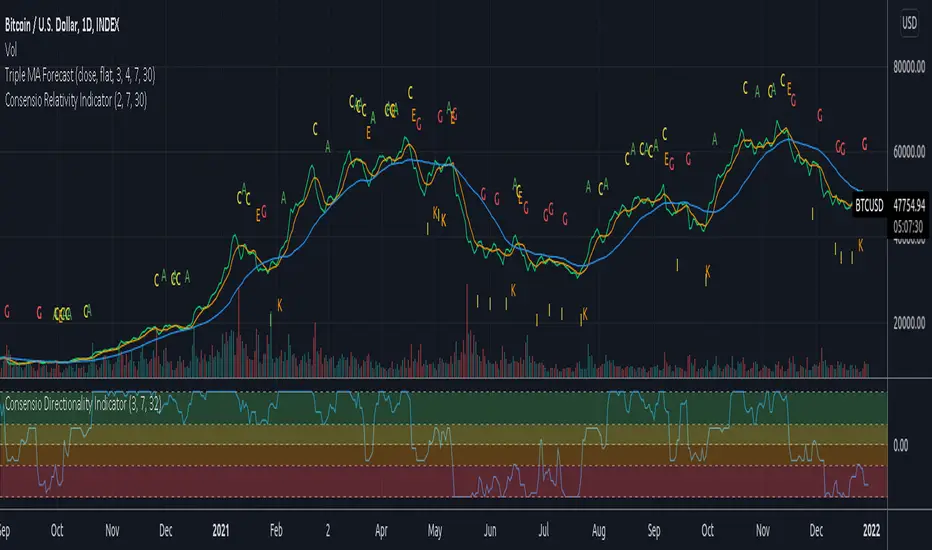
It is showing you in real-time when Relativity is changing. It will help you understand when you should probably lower your position, and when to strengthen your position, when to enter a market, and when to exit a market.
What is Relativity?
According to this trading system, you start by laying 3 Simple Moving Averages:
*The "Price" should be A relatively short Moving Average in order to reflect the current price.
When laying out those 3 Moving averages on top of each other, you discover 13 unique types of relationships:
So what's the big deal, you may ask?
For the market to go from Bullish State (type A) to Bearish state (type G), the Market must pass through Relativity B, C, D, E, F.
For the market to go from Bearish State (type G) to Bullish state (type A), the Market must pass through Relativity H, I, J, K, L.
Knowing This principle helps you better plan when to enter a market, and when to exit a market, when to Lower your position and when to strengthen your position.
Recommendations
It is showing you in real-time when Relativity is changing. It will help you understand when you should probably lower your position, and when to strengthen your position, when to enter a market, and when to exit a market.
What is Relativity?
According to this trading system, you start by laying 3 Simple Moving Averages:
- A Long-Term Moving Average (LTMA).
- A Short-Term Moving Average (STMA).
- A Price Moving Average (Price).
*The "Price" should be A relatively short Moving Average in order to reflect the current price.
When laying out those 3 Moving averages on top of each other, you discover 13 unique types of relationships:
- Relativity A: Price > STMA, Price > LTMA, STMA > LTMA
- Relativity B: Price = STMA, Price > LTMA, STMA > LTMA
- Relativity C: Price < STMA, Price > LTMA, STMA > LTMA
- Relativity D: Price < STMA, Price = LTMA, STMA > LTMA
- Relativity E: Price < STMA, Price < LTMA, STMA > LTMA
- Relativity F: Price < STMA, Price < LTMA, STMA = LTMA
- Relativity G: Price < STMA, Price < LTMA, STMA < LTMA
- Relativity H: Price = STMA, Price < LTMA, STMA < LTMA
- Relativity I: Price > STMA, Price < LTMA, STMA < LTMA
- Relativity J: Price > STMA, Price = LTMA, STMA < LTMA
- Relativity K: Price > STMA, Price > LTMA, STMA < LTMA
- Relativity L: Price > STMA, Price > LTMA, STMA = LTMA
- Relativity M: Price = STMA, Price = LTMA, STMA = LTMA
So what's the big deal, you may ask?
For the market to go from Bullish State (type A) to Bearish state (type G), the Market must pass through Relativity B, C, D, E, F.
For the market to go from Bearish State (type G) to Bullish state (type A), the Market must pass through Relativity H, I, J, K, L.
Knowing This principle helps you better plan when to enter a market, and when to exit a market, when to Lower your position and when to strengthen your position.
Recommendations
- Different Moving Averages may suit you better when trading different assets on different time periods. You can go into the indicator settings and change the Moving Averages values if needed.
- When Moving Averages are consolidating, the Relativity can change direction more often. When this happens, it is better to wait for a stronger signal than to trade on every signal.
- you should also use the "Consensio Directionality Indicator" to predict the directionality of the market. While using both of my Consensio indicators together, please make sure that the Moving Averages on both of them are set to the same values
- Consensio Trading System encourages you to make decisions based on Moving Averages only. I highly recommend disabling "candle view" by switching to "line view" and changing the opacity of the line to 0.
發行說明
G signal fixed發行說明
B, F, H, J signals fixed開源腳本
秉持TradingView一貫精神,這個腳本的創作者將其設為開源,以便交易者檢視並驗證其功能。向作者致敬!您可以免費使用此腳本,但請注意,重新發佈代碼需遵守我們的社群規範。
免責聲明
這些資訊和出版物並非旨在提供,也不構成TradingView提供或認可的任何形式的財務、投資、交易或其他類型的建議或推薦。請閱讀使用條款以了解更多資訊。
開源腳本
秉持TradingView一貫精神,這個腳本的創作者將其設為開源,以便交易者檢視並驗證其功能。向作者致敬!您可以免費使用此腳本,但請注意,重新發佈代碼需遵守我們的社群規範。
免責聲明
這些資訊和出版物並非旨在提供,也不構成TradingView提供或認可的任何形式的財務、投資、交易或其他類型的建議或推薦。請閱讀使用條款以了解更多資訊。