INVITE-ONLY SCRIPT
VSA + Volume Oscillator [@TradersVenue]
已更新
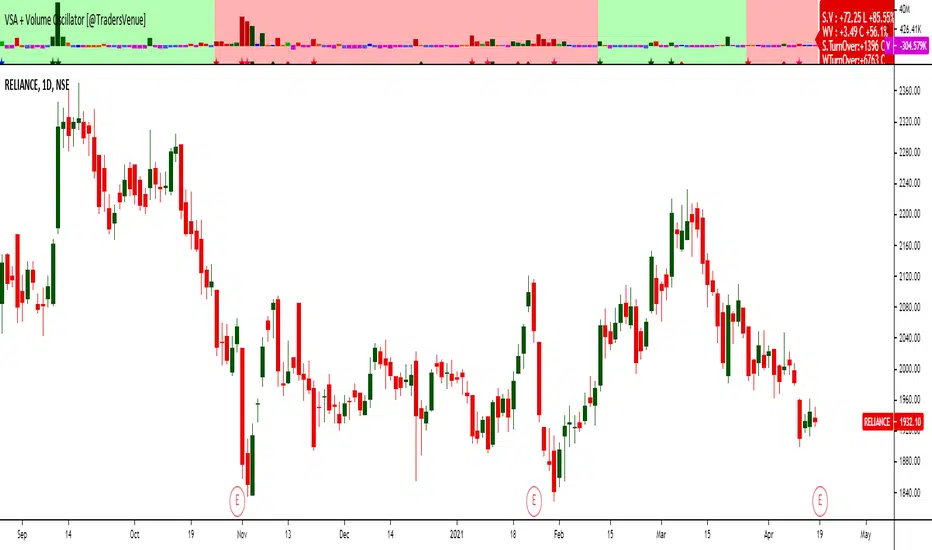
Volume is very crucial while trading, as it indicates the participants interest in the script. Focus is to look for the high volume candles which had a significant price action to initiate a trade on the scrip. This volume indicator combines the VSA signals along with volume and highlights price action using different symbols.
Highlights:
Major Sign of Strength (SoS) - Downthrust Bar supported by momentum & in the direction of trend (Green Star Under the candle)
Any candle highlighted with a Green star is a solid breakout candle where price volume action indicates that participants wants the price to move up. This is normally a wide range bar with ultra high volume closing near the upper part of the candle. Also the trend and momentum favours the breakout which is identified using MA & RSI to support the bullish case.
Major Sign of Weakness (SoW) - Upthrust Bar supported by momentum & in the direction of trend (Red Star Under the candle)
Any candle highlighted with a Red star is a solid breakdown candle where price volume action indicates that participants wants the price to move down. This is normally a wide range bar with ultra high volume closing near the lower part of the candle. Also the trend and momentum favours the breakout which is identified using MA & RSI to support the bullish case.
Normally prefer trading the scrip in the direction of breakout or breakdown after noticing a starcandle. Apart from that there are some important VSA signals for which quick cheet sheet is given below.
Sign of Strength (SoS) - Green Star/Circle/Square
Sign of Weakness (SoW) - Red Star/Circle/Square
Circle represents - Stopping Volume (SV) if green, Supply Overcomes Demand (SoD) if red.
Square represents a TrendReversal (TR), if green bullish, if red bearish
Apart from that you can view the volumes either in the form of oscillator which is calculated basis the standard deviation or normal volumes. Deep Green/Green volume bars represent high volume green candle. Deep Red/Red candle represents high volume sell candle. Pink and blue candles are those where volume action is low or negligible to take any trade basis that. Prefer using the indicator with default settings.
Price action is least lagging indicator as compared to other indicators. And as usual no indicator has 100% success rate. So I urge all users not to consider this as a holy grail. This indicator need to be used along with the VSA signal indicator (which can be plotted on the chart) and RSI indicator which is provided as full VSA trading setup for swing trades. The overall usage will be provided through a demo to the subscribing users. In order to gain access to this indicator you may contact me using the below signature.
發行說明
Below fixes done on the script1) Color change basis volatility shift and VSA breakouts. Now background color remains green after a VSA Breakout till next Breakdown and vice versa.
2) Added alerts for "VSA BreakOut" and "VSA Breakdown"
3) At times the VSA highlighting symbols were not visible. Did fix so that it remains visible all times when oscillator mode is active.
發行說明
There is a major change. Upgrade your script to take the benefit of the change. If you have already applied the script, then you can change its version to latest.1) Added Turnover information for current timeframe candle and higher timeframe candle. D=Daily W=Weekly
2) Added volume for current candle and higher timeframe candle.
3) Just move mouse over the label to see the tool tip on shortcuts.
發行說明
Must have update. Enhancements for scalping in 3/5/10M timeframes.發行說明
Updated the publishing removing other indicators. No major changes done in this release.僅限邀請腳本
僅限作者授權的用戶訪問此腳本,並且通常需要付費。您可以將其增加到收藏腳本中,但是只有在向作者請求並獲得許可之後,才能使用它。 請聯繫TradersVenue以了解更多信息,或按照下面作者的說明進行操作。
TradingView 不建議購買並使用此腳本,除非您 100% 信任其作者並了解腳本的工作原理。在許多情況下,您可以在我們的社群腳本中免費找到良好的開源替代方案。
作者的說明
″You can connect to me directly using the details given in signature field for gaining access to the script
想在圖表上使用此腳本?
警告:請閱讀,然後再請求訪問權限。
For queries, suggestions, access requests you can reach out to me using below social media handles.
EMail_ID:- support@tradersvenue.com
Telegram: t.me/TradersVenue
Twitter: twitter.com/PB_Fin
YouTube: youtube.com/channel
EMail_ID:- support@tradersvenue.com
Telegram: t.me/TradersVenue
Twitter: twitter.com/PB_Fin
YouTube: youtube.com/channel
免責聲明
這些資訊和出版物並不意味著也不構成TradingView提供或認可的金融、投資、交易或其他類型的意見或建議。請在使用條款閱讀更多資訊。