OPEN-SOURCE SCRIPT
已更新 Consecutive Close Tracker (CCT)
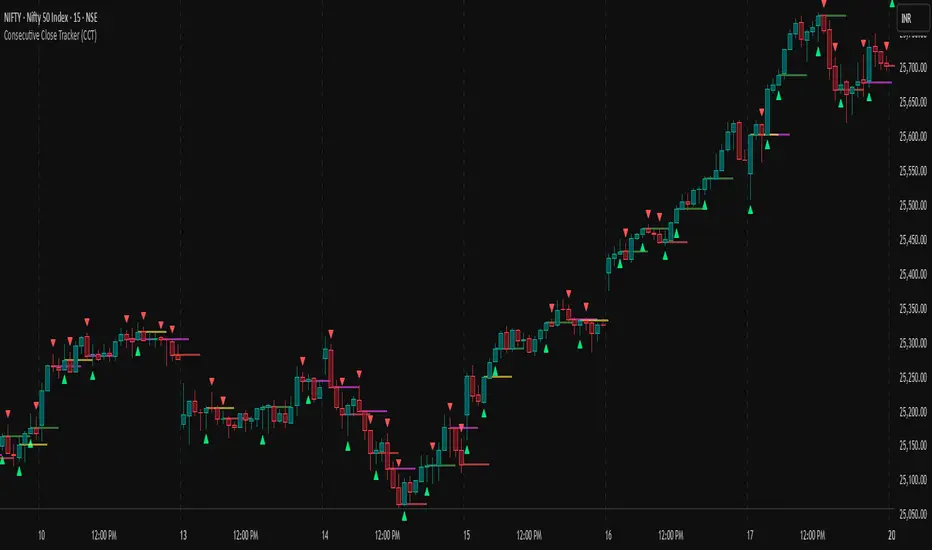
Consecutive Close Tracker (CCT) Indicator
The Consecutive Close Tracker (CCT) is a powerful momentum and breakout detection tool designed to identify consecutive bullish and bearish closes, potential reversals, and breakout points. By tracking consecutive candle closes and plotting key levels, this indicator provides traders with visual cues to recognize trend continuations, reversals, and breakout opportunities effectively.
🔹 Key Features of CCT
1️⃣ Consecutive Move Lines (Green/Red/Yellow Lines)
Tracks three consecutive bullish or bearish closes.
If the fourth candle confirms the trend, a green line (bullish) or red line (bearish) is drawn.
If the fourth candle fails to confirm, a yellow line is drawn, signaling potential indecision.
Helps traders spot trend continuations and exhaustion points.
2️⃣ Reversal Detection Lines (Cyan & Light Red)
Identifies bullish and bearish reversals based on three higher/lower closes followed by a reversal.
A cyan line indicates a bullish reversal, while a light red line signals a bearish reversal.
Useful for traders looking for trend reversals and key turning points.
3️⃣ Breakout Line (Dynamic Resistance/Support Level)
Automatically calculates a breakout level based on the previous timeframe’s open and close.
Can be customized to use different timeframes (e.g., hourly, daily, weekly).
Acts as a dynamic resistance or support level, helping traders determine breakout opportunities.
🔍 How to Use the Indicator?
✅ 1. Spotting Trend Continuations with Consecutive Move Lines
Green Line: Three consecutive bullish closes followed by a fourth higher close.
🚀 Indicates strong buying pressure & potential uptrend continuation.
Red Line: Three consecutive bearish closes followed by a fourth lower close.
📉 Indicates strong selling pressure & potential downtrend continuation.
Yellow Line: Three consecutive closes, but the fourth candle fails to confirm.
⚠️ Signals possible indecision or trend exhaustion.
🔥 Best Strategy:
If a green line appears near support, consider long entries.
If a red line appears near resistance, consider short entries.
If a yellow line appears, wait for further confirmation before entering a trade.
✅ 2. Identifying Trend Reversals with Reversal Lines
Cyan Line: A bearish trend with three consecutive lower closes, followed by a bullish candle → Possible uptrend reversal.
Light Red Line: A bullish trend with three consecutive higher closes, followed by a bearish candle → Possible downtrend reversal.
🔥 Best Strategy:
If a cyan line appears near a major support level, look for long entry opportunities.
If a light red line appears near resistance, prepare for a potential short entry.
Use these lines in combination with candlestick patterns (e.g., bullish engulfing, pin bars) for confirmation.
✅ 3. Using the Breakout Line for Key Entry & Exit Points
The breakout line represents a key dynamic level (midpoint of the previous timeframe’s open & close).
If price breaks above the breakout line, it suggests bullish momentum → Consider long trades.
If price breaks below the breakout line, it suggests bearish momentum → Consider short trades.
🔥 Best Strategy:
Use the breakout line in combination with support & resistance levels.
When price approaches the breakout line, watch for confirmation candles before entering a trade.
The breakout line can also act as a stop-loss or take-profit level.
🎯 How to Utilize CCT Effectively?
✅ For Intraday Traders
Use the consecutive close tracker on a 5M or 15M chart to catch short-term trends.
Watch for reversal lines near major intraday support/resistance for quick scalping opportunities.
Use the breakout line from the hourly chart to identify potential trend shifts.
✅ For Swing Traders
Apply the indicator on 1H, 4H, or daily charts to track medium-term trends.
Look for green/red lines near key Fibonacci retracement or pivot levels.
Use reversal lines to detect early trend reversals before bigger moves occur.
✅ For Breakout Traders
Focus on the breakout line on higher timeframes (e.g., 1H, 4H, Daily) to identify strong momentum shifts.
If price crosses the breakout line with strong volume, enter trades with trend confirmation.
Place stop-loss just below the breakout level for controlled risk management.
🏆 Final Thoughts
The Consecutive Close Tracker (CCT) is a powerful momentum and reversal indicator that helps traders:
✅ Identify strong trend continuations (green/red lines).
✅ Detect early reversal points (cyan/light red lines).
✅ Use a dynamic breakout line for better trade entries & exits.
Whether you’re an intraday trader, swing trader, or breakout trader, this tool can enhance your market insights and improve your trading decisions. 📈🔥
🚀 Try it out, and integrate it with your strategy to maximize its potential! 🚀
發行說明
This script tracks consecutive closing patterns to identify potential trend continuations and reversals.✅ Key Features:
CCT Lines: Plots lines after 3 consecutive closes in the same direction, confirmed by a 4th candle continuation.
Reversal Lines: Highlights possible reversals after 3 higher or lower closes followed by a reversal candle.
Breakout Line: Automatically draws a breakout line from the average of previous open and close based on timeframe logic.
🔄 New Enhancements (v2):
🆕 Supports plotting up to 500 lines, enabling historical visibility across more candles.
🛠 No changes to the original logic – fully backward compatible.
📈 Suitable for scalpers, swing traders, and trend followers who want clean visual signals.
📌 Options include toggling:
Consecutive Close Signal Lines
Breakout Line (with auto-timeframe option)
Reversal Detection Lines
Built for clarity, flexibility, and insight into market structure.
🧠 Ideal Use Cases:
Spotting early trends or reversals with consecutive close confirmation
Visualizing breakout zones across dynamic timeframes
Enhancing entries/exits with color-coded signal lines
發行說明
Consecutive Close Tracker (CCT) – New VersionDescription:
The Consecutive Close Tracker (CCT) identifies sequences of consecutive bullish or bearish closes and plots clear horizontal lines highlighting these moves. It also includes reversal line detection and advanced entry signals to help traders visualize potential trading opportunities based on consecutive price action.
What’s New / Improved:
Line Customization: Users can now select line style (solid, dashed, dotted), line width, and line transparency for both consecutive move and reversal lines.
Entry Signals (Main Feature Added):
Optional bullish and bearish entry markers are plotted directly after consecutive moves or reversal lines.
Users can select marker size (tiny, small, normal).
Entry alerts are included for both bullish and bearish setups.
This allows traders to identify precise entry opportunities immediately after a valid setup, enhancing the usability of the indicator for trading decisions.
Reversal Signals as Pullback Entries:
By observing Reversal Signal Lines and Reversal Entry Signals, traders can easily spot price action pullbacks.
These signals act as excellent pullback entry points after a trend is established.
Identify the trend using your preferred method (e.g., MA, higher timeframe direction) and use Reversal Signals to enter trades on pullbacks.
Alerts: Built-in alert conditions for bullish and bearish entry signals.
Tooltips: Every input field now includes a tooltip to guide users.
Removed Breakout Line: The breakout line from the previous version has been removed as it is not directly related to consecutive close tracking. Users now have more flexibility to use their preferred trend filter instead.
Why the Breakout Line Was Removed:
The breakout line in the earlier version showed the midpoint of the previous candle in a different timeframe. While useful for trend filtering, it is not essential to the core CCT concept. Removing it makes the indicator more focused, clean, and user-friendly. Users who want a trend filter can now easily choose their own preferred method.
Suggested Trend Filter Options:
Traders can combine CCT with their preferred trend filter to take trades in the direction of the trend:
Moving Averages: e.g., 20 EMA, 50 SMA – take bullish entries only above MA, bearish entries only below MA.
Ichimoku Cloud: Use the cloud direction to filter trades.
Price Action Levels: Key support/resistance or pivot levels to filter valid entries.
Higher Timeframe Direction: Use higher timeframe candle closes to confirm the trend.
How to Use Effectively:
Observe consecutive close lines (green/red) to identify strong bullish/bearish moves.
Use reversal lines to spot potential counter-trend reversals.
Enable entry markers and alerts to catch trade opportunities.
Apply a trend filter (MA, higher timeframe trend, or other) to trade in the trend direction.
Use entry signals for precise trade timing immediately after valid consecutive moves or reversals.
Use Reversal Signal Lines as pullback entry points in the trend for better trade entries.
開源腳本
秉持TradingView一貫精神,這個腳本的創作者將其設為開源,以便交易者檢視並驗證其功能。向作者致敬!您可以免費使用此腳本,但請注意,重新發佈代碼需遵守我們的社群規範。
免責聲明
這些資訊和出版物並非旨在提供,也不構成TradingView提供或認可的任何形式的財務、投資、交易或其他類型的建議或推薦。請閱讀使用條款以了解更多資訊。
開源腳本
秉持TradingView一貫精神,這個腳本的創作者將其設為開源,以便交易者檢視並驗證其功能。向作者致敬!您可以免費使用此腳本,但請注意,重新發佈代碼需遵守我們的社群規範。
免責聲明
這些資訊和出版物並非旨在提供,也不構成TradingView提供或認可的任何形式的財務、投資、交易或其他類型的建議或推薦。請閱讀使用條款以了解更多資訊。