OPEN-SOURCE SCRIPT
已更新 trend_vol_forecast
Note: The following description is copied from the script's comments. Since TradingView does not allow me to edit this description, please refer to the comments and release notes for the most up-to-date information.
-----------
USAGE
This script compares trend trading with a volatility stop to "buy and hold".
Trades are taken with the trend, except when price exceeds a volatility
forecast. The trend is defined by a moving average crossover. The forecast
is based on projecting future volatility from historical volatility.
The trend is defined by two parameters:
- long: the length of a long ("slow") moving average.
- short: the length of a short ("fast") moving average.
The trend is up when the short moving average is above the long. Otherwise
it is down.
The volatility stop is defined by three parameters:
- volatility window: determines the number of periods in the historical
volatility calculation. More periods means a slower (smoother)
estimate of historical volatility.
- stop forecast periods: the number of periods in the volatility
forecast. For example, "7" on a daily chart means that the volatility
will be forecasted with a one week lag.
- stop forecast stdev: the number of standard deviations in the stop
forecast. For example, "2" means two standard deviations.
EXAMPLE
The default parameters are:
- long: 50
- short: 20
- volatility window: 30
- stop forecast periods: 7
- stop forecast standard deviations: 1
The trend will be up when the 20 period moving average is above the 50
period moving average. On each bar, the historical volatility will be
calculated from the previous 30 bars. If the historical volatility is 0.65
(65%), then a forecast will be drawn as a fuchsia line, subtracting
0.65 * sqrt(7 / 365) from the closing price. If price at any point falls
below the forecast, the volatility stop is in place, and the trend is
negated.
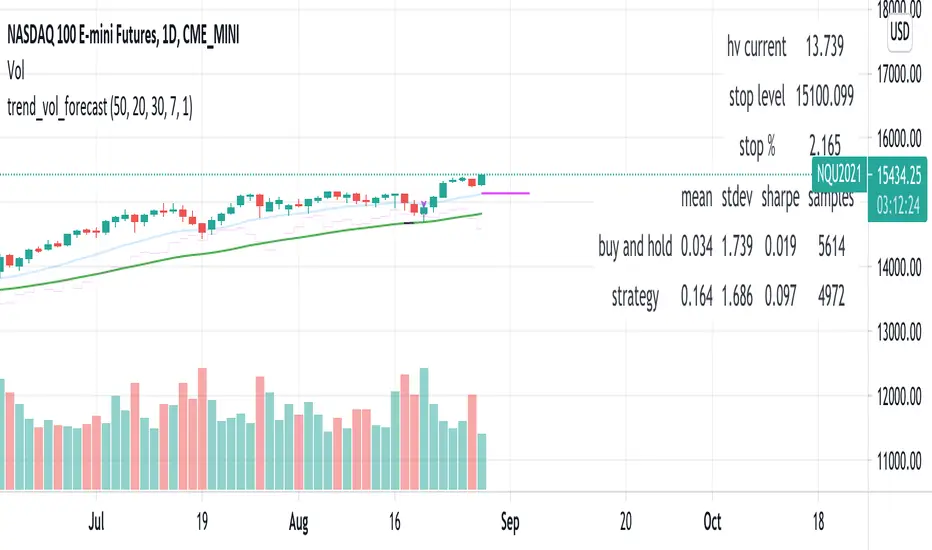
OUTPUTS
Plots:
- The trend is shown by painting the slow moving average green (up), red
(down), or black (none; volatility stop).
- The fast moving average is shown in faint blue
- The previous volatility forecasts are shown in faint fuchsia
- The current volatility forecast is shown as a fuchsia line, projecting
into the future as far as it is valid.
Tables:
- The current historical volatility is given in the top right corner, as a
whole number percentage.
- The performance table shows the mean, standard deviation, and sharpe
ratio of the volatility stop trend strategy, as well as buy and hold.
If the trend is up, each period's return is added to the sample (the
strategy is long). If the trend is down, the inverse of each period's
return is added to the sample (the strategy is short). If there is no
trend (the volatility stop is active), the period's return is excluded
from the sample. Every period is added to the buy-and-hold strategy's
sample. The total number of periods in each sample is also shown.
-----------
USAGE
This script compares trend trading with a volatility stop to "buy and hold".
Trades are taken with the trend, except when price exceeds a volatility
forecast. The trend is defined by a moving average crossover. The forecast
is based on projecting future volatility from historical volatility.
The trend is defined by two parameters:
- long: the length of a long ("slow") moving average.
- short: the length of a short ("fast") moving average.
The trend is up when the short moving average is above the long. Otherwise
it is down.
The volatility stop is defined by three parameters:
- volatility window: determines the number of periods in the historical
volatility calculation. More periods means a slower (smoother)
estimate of historical volatility.
- stop forecast periods: the number of periods in the volatility
forecast. For example, "7" on a daily chart means that the volatility
will be forecasted with a one week lag.
- stop forecast stdev: the number of standard deviations in the stop
forecast. For example, "2" means two standard deviations.
EXAMPLE
The default parameters are:
- long: 50
- short: 20
- volatility window: 30
- stop forecast periods: 7
- stop forecast standard deviations: 1
The trend will be up when the 20 period moving average is above the 50
period moving average. On each bar, the historical volatility will be
calculated from the previous 30 bars. If the historical volatility is 0.65
(65%), then a forecast will be drawn as a fuchsia line, subtracting
0.65 * sqrt(7 / 365) from the closing price. If price at any point falls
below the forecast, the volatility stop is in place, and the trend is
negated.
OUTPUTS
Plots:
- The trend is shown by painting the slow moving average green (up), red
(down), or black (none; volatility stop).
- The fast moving average is shown in faint blue
- The previous volatility forecasts are shown in faint fuchsia
- The current volatility forecast is shown as a fuchsia line, projecting
into the future as far as it is valid.
Tables:
- The current historical volatility is given in the top right corner, as a
whole number percentage.
- The performance table shows the mean, standard deviation, and sharpe
ratio of the volatility stop trend strategy, as well as buy and hold.
If the trend is up, each period's return is added to the sample (the
strategy is long). If the trend is down, the inverse of each period's
return is added to the sample (the strategy is short). If there is no
trend (the volatility stop is active), the period's return is excluded
from the sample. Every period is added to the buy-and-hold strategy's
sample. The total number of periods in each sample is also shown.
發行說明
- fixed the purple forecast lines to show the projected bound for the next N periods (not from the previous N periods, like the plots show)- changed the forecast plot style to be more pleasing
開源腳本
本著TradingView的真正精神,此腳本的創建者將其開源,以便交易者可以查看和驗證其功能。向作者致敬!雖然您可以免費使用它,但請記住,重新發佈程式碼必須遵守我們的網站規則。
免責聲明
這些資訊和出版物並不意味著也不構成TradingView提供或認可的金融、投資、交易或其他類型的意見或建議。請在使用條款閱讀更多資訊。
開源腳本
本著TradingView的真正精神,此腳本的創建者將其開源,以便交易者可以查看和驗證其功能。向作者致敬!雖然您可以免費使用它,但請記住,重新發佈程式碼必須遵守我們的網站規則。
免責聲明
這些資訊和出版物並不意味著也不構成TradingView提供或認可的金融、投資、交易或其他類型的意見或建議。請在使用條款閱讀更多資訊。