INVITE-ONLY SCRIPT
DepthHouse Relative Momentum Range Oscillator
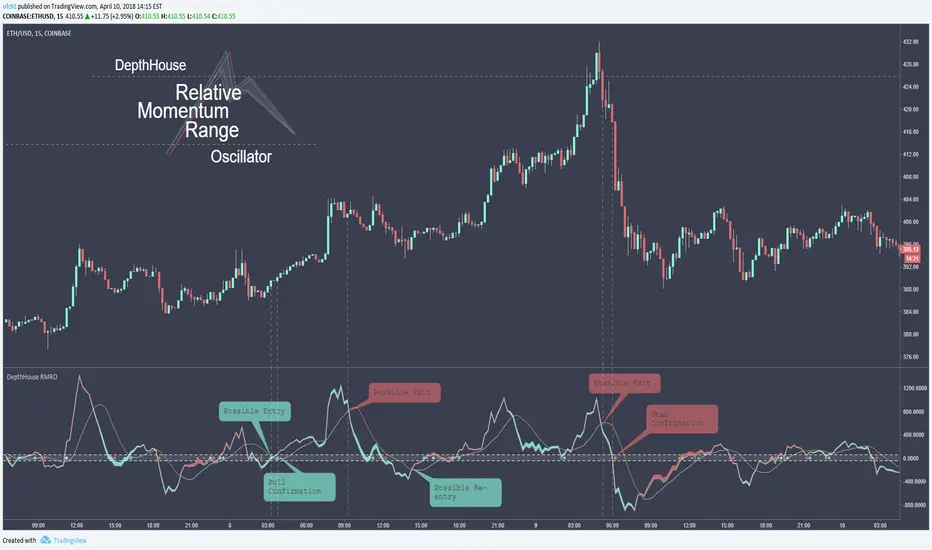
DepthHouse Relative Momentum Range Oscillator uses several calculations between the relative momentum and range to help determine trend direction and strength.
Breakouts above the adjustable horizontal zone often serve as a bullish confirmation, while breakout below the horizontal zone often serve as a bearish confirmation.
Crosses of gold and yellow signal line represent trend consolidation and/or possible reversal zones.
How to get:
As you can see this is an invite only script. In the coming month this indicator, along with many others will become pay to use only. (website on my profile page)
However all my indicators will be FREE until May 1, 2018. So please try them out!
To take advantage of this FREE trial:
1. Leave comment on this indicator post! Maybe even give me a follow :D
2. Check out and take advantage of all my other indicators!
I hope you all enjoy!
Notes:
Signals Beta:
Both functions give possible buy and sell signals shown by the circles in the middle. The strength of the signal is shown by the circle size. The larger the circle, the stronger the signal.
This feature is in beta testing is not advised to trade off of.
Altering the Multi-Factor will adjust the dotted signals at the bottom.
This is a heavily modified version of my DepthHouse Envelope Oscillator
Creator of DepthHouse Indicators on TradingView!
↣ depthhouse.com/
↣ depthhouse.com/
免責聲明
這些資訊和出版物並不意味著也不構成TradingView提供或認可的金融、投資、交易或其他類型的意見或建議。請在使用條款閱讀更多資訊。