OPEN-SOURCE SCRIPT
已更新 FIBI
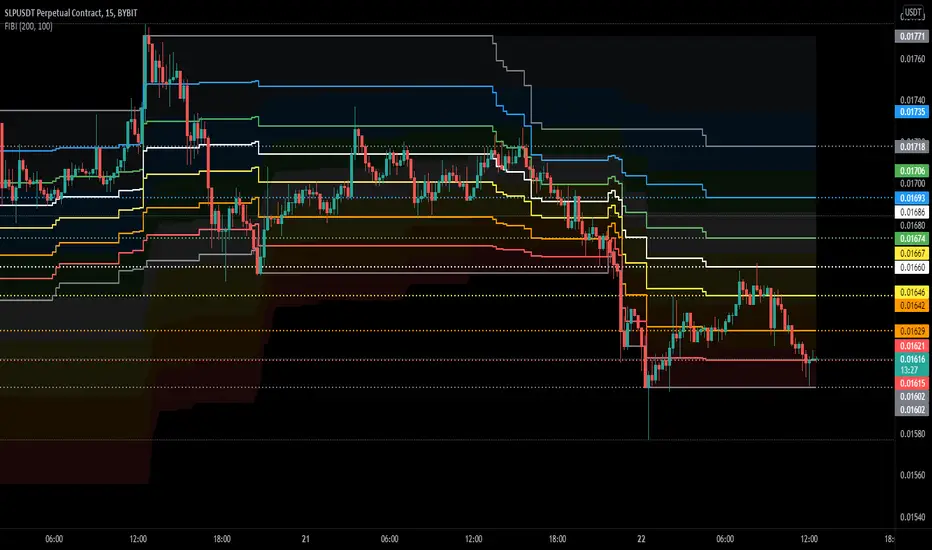
Shows Fibonacci waves for a long range and Fibonacci lines for a short range.
For me it helps to identify key levels or confluence on the macro and micro range.
In the example above you can clearly see that the macro waves are in a down-trend while the micro lines are in a up-trend..
Also the price has been rejected at the 78.6 fib mirco line but found support on the 78.6 macro wave.
these situations are hard to find with the default retracement tools
發行說明
Code clean up發行說明
Using bands instead of area發行說明
Chart updated發行說明
Added 23.6 FIB開源腳本
秉持TradingView一貫精神,這個腳本的創作者將其設為開源,以便交易者檢視並驗證其功能。向作者致敬!您可以免費使用此腳本,但請注意,重新發佈代碼需遵守我們的社群規範。
免責聲明
這些資訊和出版物並非旨在提供,也不構成TradingView提供或認可的任何形式的財務、投資、交易或其他類型的建議或推薦。請閱讀使用條款以了解更多資訊。
開源腳本
秉持TradingView一貫精神,這個腳本的創作者將其設為開源,以便交易者檢視並驗證其功能。向作者致敬!您可以免費使用此腳本,但請注意,重新發佈代碼需遵守我們的社群規範。
免責聲明
這些資訊和出版物並非旨在提供,也不構成TradingView提供或認可的任何形式的財務、投資、交易或其他類型的建議或推薦。請閱讀使用條款以了解更多資訊。