OPEN-SOURCE SCRIPT
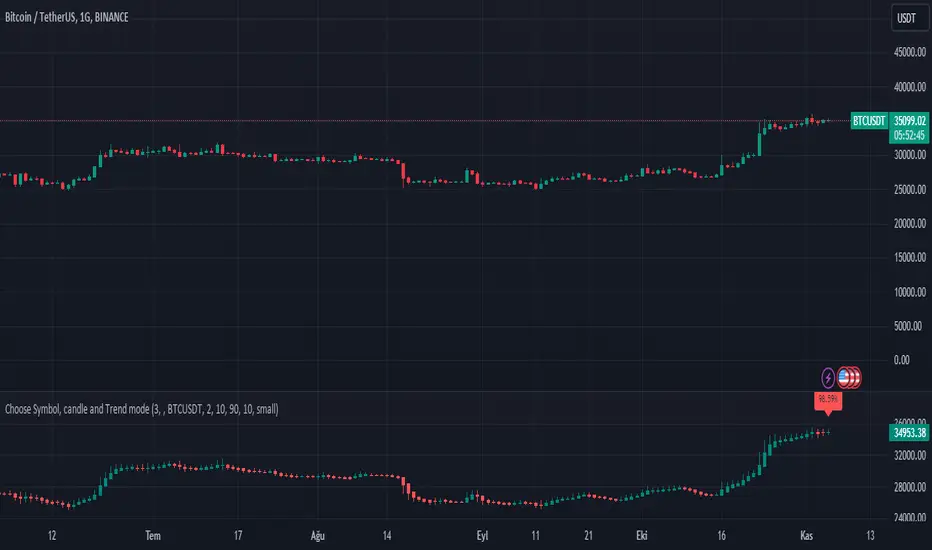
已更新 Choose Symbol, candle and Trend mode
This Pine Script code is designed for technical analysis and visualization of price movements on the TradingView platform. It serves as a tool for traders and investors to:
Price Chart Analysis: The code plots the price chart of a selected symbol and utilizes Heikin-Ashi candlesticks to visualize price movements. This aids in better understanding price trends, support and resistance levels, retracements, and other price actions.
Trend Identification: The code also employs the Exponential Moving Average (EMA) to identify the price trend. EMA is commonly used to determine the strength and direction of a trend. Traders and investors can use this information to track trends and develop trading strategies.
Buy and Sell Signals: The code generates buy and sell signals based on EMA. These signals provide information on when to consider buying or selling a specific symbol. This is particularly useful for traders when making trading decisions.
Timeframe Customization: Users can adapt the code to different timeframes. This flexibility is valuable for those looking to develop strategies for both short-term and long-term trading.
Customization: The code allows users to customize various parameters, including the symbol, timeframe, Heikin-Ashi mode, and others. This enables it to be tailored to different assets and trading styles.
Please note that this code is provided for educational and informational purposes only. It does not constitute financial advice or recommendations for specific trading actions. Any trading decisions made using this code should be based on individual research, analysis, and a clear understanding of the associated risks.
發行說明
This Pine Script code is designed for technical analysis and visualization of price movements on the TradingView platform. It serves as a tool for traders and investors to:Price Chart Analysis: The code plots the price chart of a selected symbol and utilizes Heikin-Ashi candlesticks to visualize price movements. This aids in better understanding price trends, support and resistance levels, retracements, and other price actions.
Trend Identification: The code also employs the Exponential Moving Average (EMA) to identify the price trend. EMA is commonly used to determine the strength and direction of a trend. Traders and investors can use this information to track trends and develop trading strategies.
Buy and Sell Signals: The code generates buy and sell signals based on EMA. These signals provide percentage information on when to consider buying or selling a specific symbol. This is particularly useful for traders when making trading decisions.
Overbought and Oversold Levels: The code allows users to set overbought and oversold levels, helping to identify potential reversal points or areas of price exhaustion.
Timeframe Customization: Users can adapt the code to different timeframes. This flexibility is valuable for those looking to develop strategies for both short-term and long-term trading.
Customization: The code allows users to customize various parameters, including the symbol, timeframe, Heikin-Ashi mode, and others. This enables it to be tailored to different assets and trading styles.
Please note that this code is provided for educational and informational purposes only. It does not constitute financial advice or recommendations for specific trading actions. Any trading decisions made using this code should be based on individual research, analysis, and a clear understanding of the associated risks.
發行說明
This Pine Script code is designed for technical analysis and visualization of price movements on the TradingView platform. It serves as a tool for traders and investors to:Price Calculation: The code calculates the Exponential Moving Averages (EMA) of open, high, low, and close prices. These moving averages are used to create smoothed price values for the Heikin-Ashi chart.
Price Chart Analysis: The code plots the price chart of a selected symbol and utilizes Heikin-Ashi candlesticks to visualize price movements. This aids in better understanding price trends, support and resistance levels, retracements, and other price actions.
Trend Identification: The code also employs the Exponential Moving Average (EMA) to identify the price trend. EMA is commonly used to determine the strength and direction of a trend. Traders and investors can use this information to track trends and develop trading strategies.
Buy and Sell Signals: The code generates buy and sell signals based on EMA. These signals provide percentage information on when to consider buying or selling a specific symbol. This is particularly useful for traders when making trading decisions.
Overbought and Oversold Levels: The code allows users to set overbought and oversold levels, helping to identify potential reversal points or areas of price exhaustion.
Timeframe Customization: Users can adapt the code to different timeframes. This flexibility is valuable for those looking to develop strategies for both short-term and long-term trading.
Customization: The code allows users to customize various parameters, including the symbol, timeframe, Heikin-Ashi mode, and others. This enables it to be tailored to different assets and trading styles.
Please note that this code is provided for educational and informational purposes only. It does not constitute financial advice or recommendations for specific trading actions. Any trading decisions made using this code should be based on individual research, analysis, and a clear understanding of the associated risks.
開源腳本
秉持TradingView一貫精神,這個腳本的創作者將其設為開源,以便交易者檢視並驗證其功能。向作者致敬!您可以免費使用此腳本,但請注意,重新發佈代碼需遵守我們的社群規範。
免責聲明
這些資訊和出版物並非旨在提供,也不構成TradingView提供或認可的任何形式的財務、投資、交易或其他類型的建議或推薦。請閱讀使用條款以了解更多資訊。
免責聲明
這些資訊和出版物並非旨在提供,也不構成TradingView提供或認可的任何形式的財務、投資、交易或其他類型的建議或推薦。請閱讀使用條款以了解更多資訊。