OPEN-SOURCE SCRIPT
15-Min ORB Indicator with Breakout Targets

**What this indicator does:**
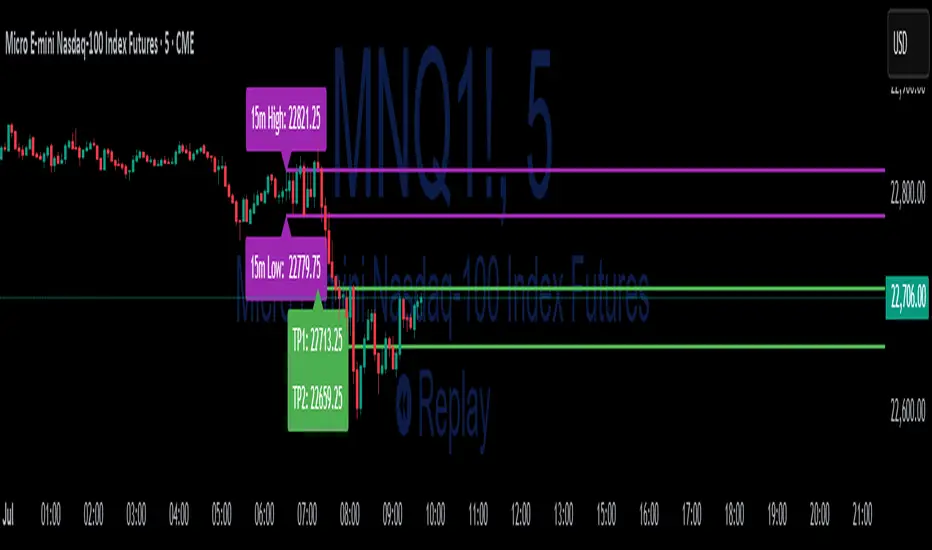
The 15-Min ORB (Opening Range Breakout) Indicator helps traders spot breakout trades by automatically detecting the high and low of the first 15 minutes after a session opens. It then monitors for breakouts above or below this range and plots dynamic take-profit levels based on your chosen multipliers.
**How it works:**
**How to use it:**
**What makes it unique and useful:**>
**Typical uses:**
The 15-Min ORB (Opening Range Breakout) Indicator helps traders spot breakout trades by automatically detecting the high and low of the first 15 minutes after a session opens. It then monitors for breakouts above or below this range and plots dynamic take-profit levels based on your chosen multipliers.
**How it works:**
- You set the start time for your session (hour and minute) in the settings.
- The indicator marks the high and low during the first 15 minutes after your chosen open time, drawing lines on the chart and, if enabled, labels for these levels.
- If price breaks above the 15-min high, a potential long breakout is identified; if it breaks below the low, a potential short breakout is detected.
- Upon a breakout, the script calculates the distance from the entry (breakout) to the opposite side of the 15-min range and uses your input multipliers to project two take-profit levels (TP1/TP2).
- All lines and labels (for the range and targets) can be individually toggled on or off in the settings.
- Both the 15-min range and the targets can be styled (color, line style, label position).
**How to use it:**
- Add the indicator to your chart.
- Set the session start hour and minute to match your instrument’s open (e.g., 9:30 for US stocks or futures).
- Use the settings to customize which levels and labels are shown, their appearance, and the target expansion multiples.
- When price breaks out above or below the opening range, the script will plot TP1 and TP2 lines at your chosen risk/reward multiples, and label them if desired.
- You can use the visual levels for trade entries, profit taking, or alerts.
**What makes it unique and useful:**>
- Unlike many basic ORB indicators, this script not only marks the opening range but also tracks breakouts, auto-plots your profit targets based on range expansion, and gives you full control over display (styles, toggles, and label positions).
- The TP targets are dynamic and can be set to any multiples, adapting to your risk/reward plan and breakout style.
- Everything is customizable for your own session times, instrument, or trading approach.
**Typical uses:**
- Intraday traders looking for clear breakout setups around the session open.
- Automated R-multiple target planning for both long and short trades.
- Visualizing volatility and measuring early price expansion.
開源腳本
秉持TradingView一貫精神,這個腳本的創作者將其設為開源,以便交易者檢視並驗證其功能。向作者致敬!您可以免費使用此腳本,但請注意,重新發佈代碼需遵守我們的社群規範。
Simple Indicators – Premium tools & more: simpleindicators.gumroad.com/
免責聲明
這些資訊和出版物並非旨在提供,也不構成TradingView提供或認可的任何形式的財務、投資、交易或其他類型的建議或推薦。請閱讀使用條款以了解更多資訊。
開源腳本
秉持TradingView一貫精神,這個腳本的創作者將其設為開源,以便交易者檢視並驗證其功能。向作者致敬!您可以免費使用此腳本,但請注意,重新發佈代碼需遵守我們的社群規範。
Simple Indicators – Premium tools & more: simpleindicators.gumroad.com/
免責聲明
這些資訊和出版物並非旨在提供,也不構成TradingView提供或認可的任何形式的財務、投資、交易或其他類型的建議或推薦。請閱讀使用條款以了解更多資訊。