OPEN-SOURCE SCRIPT
Tradytics Levels with EMA Cloud
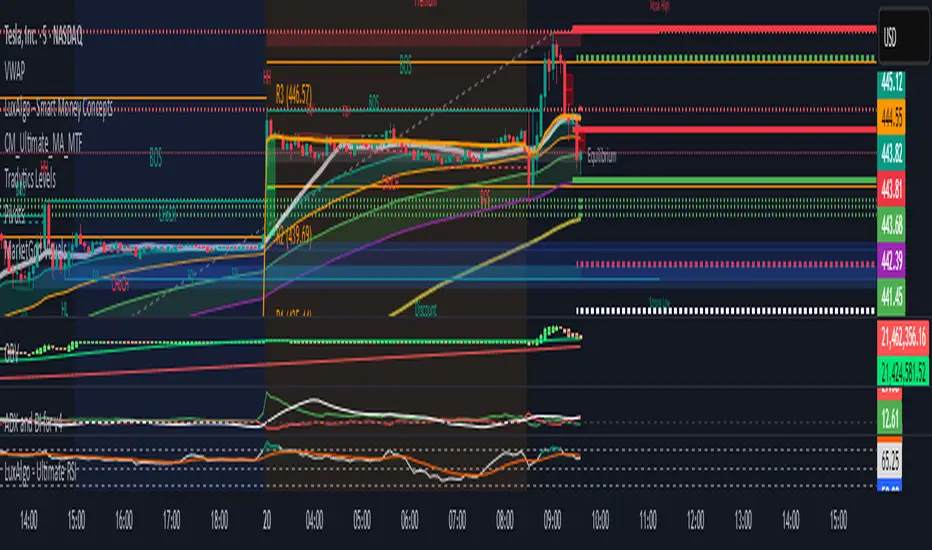
This indicator has tradytics price chart levels where you can put in the input code seen below.
The code has positive gamma (green lines), negative gamma (Red lines) and white dotted line are the darkpool levels.
This is Amazon's 5 minute from Sep30th to October 20th Gammas and weekly Darkpool levels. Just copy and paste code below in the input code and the chart would show the levels.
212.8*1*neutral 220.07*1*neutral 216.038*1*neutral 215.57*1*neutral 219.988*1*neutral 217.401*1*neutral 217.351*1*neutral 212.815*1*neutral 212.75*1*neutral 212.4*1*neutral 215*0*negative 222.5*0*positive 217.5*0*positive 220*0*positive
開源腳本
秉持TradingView一貫精神,這個腳本的創作者將其設為開源,以便交易者檢視並驗證其功能。向作者致敬!您可以免費使用此腳本,但請注意,重新發佈代碼需遵守我們的社群規範。
免責聲明
這些資訊和出版物並非旨在提供,也不構成TradingView提供或認可的任何形式的財務、投資、交易或其他類型的建議或推薦。請閱讀使用條款以了解更多資訊。
開源腳本
秉持TradingView一貫精神,這個腳本的創作者將其設為開源,以便交易者檢視並驗證其功能。向作者致敬!您可以免費使用此腳本,但請注意,重新發佈代碼需遵守我們的社群規範。
免責聲明
這些資訊和出版物並非旨在提供,也不構成TradingView提供或認可的任何形式的財務、投資、交易或其他類型的建議或推薦。請閱讀使用條款以了解更多資訊。