INVITE-ONLY SCRIPT
已更新 Nifty-Banknifty-Option-Writer
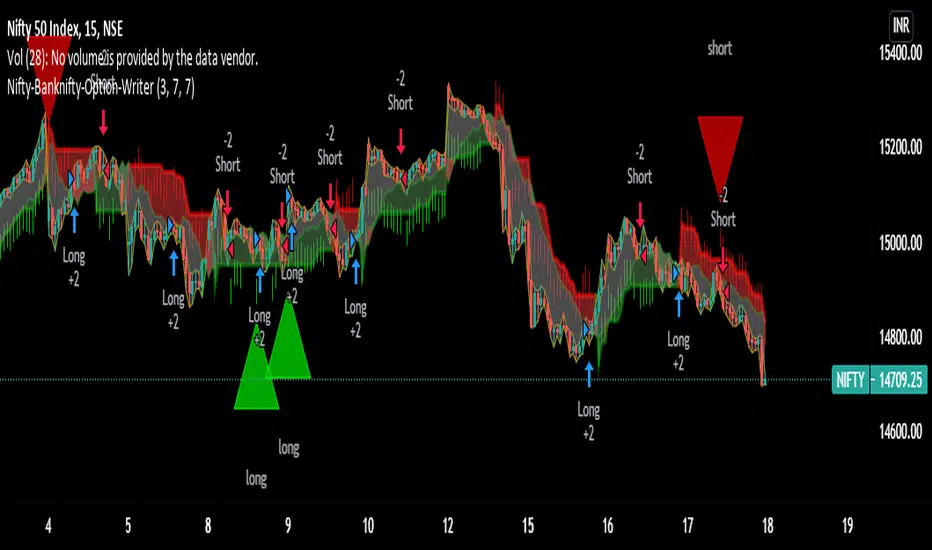
Nifty-Banknifty-Option-Writer tool is having signals like below
1) Bullish signal for taking long trade
2) Bearish signal for taking short trade
3) Triangle UP signal for trend change Long trade
4) Triangle Down signal for trend change Short trade
5) Big Arrow down signal for closing long trade if u have any short trades
6) Big Arrow UP signal for closing Short trade if i have any long trades
7) This tool is having three zone GREEN, RED and GRAY
8) small red arrow and small green arrow
===========================================================================================
How to use this tool:-
You should take long trade in index call option or sell put option when you will get Bullish signal or Big green Triangle and book the profit when you get any red signal either Its Big red triangle or Bearish signal or big downward red arrow close long trade or small red arrow.
Similarly you can take long trade for Index put option or sell call option for Short trade when you get Bearish signal or Big red triangle and book the profit when you will get close long big green arrow signal or small green arrow or Bullish signal or Big green triangle.
-If candle formation is having above GREEN and GRAY zone then it signifies strength is bullish and remain in Long trade till you are not getting close long trade signal or small red downward arrow signal.
-If candle formation is happening below RED and GRAY zone then it signifies strength is bearish and remain in short trade till you are not getting close short trade signal or small green upward arrow signal.
I have taken combination of ATR, Super trend and RSI to get the trend and trend change of underlying.
this tool i have created for any underlying not specific to Nifty or Banknifty though I have used this name so Indian can take benefit for Index trading.
Still didn't understand then ping me or give me call on my number given in signature i will make zoom call with you so will understand how to use this script.
=============================================================
I have taking consideration of Bullish and Bearish trade for strategy and its giving its optimal result in 1 hr time frame.
I have added commission/slippage for trade so actual result can be displayed in strategy tester.
Ping me or DM me to subscribe this indicator.
I have given all my indicator details below link (Signature URL). You can check indicators and call me on given number or email me on given email to access the scripts and indicators. Telegram link is also given you can ping me there.
--------------------------------------------------------------------------------------------------------------------------------------
Disclaimer : Past performance of the indicator is not giving guarantee for future performance as well, it may change as per market condition.
-------------------------------------------------------------------------------------------------------------------------------------
發行說明
Removed Bullish and Bearish with long and short text and removed plot for same and used strategy.僅限邀請腳本
僅作者批准的使用者才能訪問此腳本。您需要申請並獲得使用許可,通常需在付款後才能取得。更多詳情,請依照作者以下的指示操作,或直接聯絡bullsbearsclub。
TradingView不建議在未完全信任作者並了解其運作方式的情況下購買或使用腳本。您也可以在我們的社群腳本中找到免費的開源替代方案。
作者的說明
use 15 minute and 5 minute chart and see the results . do paper trading before jump into real live trading
Join my Educational Telegram channel:
t.me/bullsbearsclub
My YouTube channel: youtube.com/channel/UC537A
My Indicator details:
docs.google.com/document/d/17wUSbSJEZR6rTNVdwqLEBaKM-CSYx-61TN0qazvsnAQ/edit?usp=sharing
t.me/bullsbearsclub
My YouTube channel: youtube.com/channel/UC537A
My Indicator details:
docs.google.com/document/d/17wUSbSJEZR6rTNVdwqLEBaKM-CSYx-61TN0qazvsnAQ/edit?usp=sharing
免責聲明
這些資訊和出版物並非旨在提供,也不構成TradingView提供或認可的任何形式的財務、投資、交易或其他類型的建議或推薦。請閱讀使用條款以了解更多資訊。
僅限邀請腳本
僅作者批准的使用者才能訪問此腳本。您需要申請並獲得使用許可,通常需在付款後才能取得。更多詳情,請依照作者以下的指示操作,或直接聯絡bullsbearsclub。
TradingView不建議在未完全信任作者並了解其運作方式的情況下購買或使用腳本。您也可以在我們的社群腳本中找到免費的開源替代方案。
作者的說明
use 15 minute and 5 minute chart and see the results . do paper trading before jump into real live trading
Join my Educational Telegram channel:
t.me/bullsbearsclub
My YouTube channel: youtube.com/channel/UC537A
My Indicator details:
docs.google.com/document/d/17wUSbSJEZR6rTNVdwqLEBaKM-CSYx-61TN0qazvsnAQ/edit?usp=sharing
t.me/bullsbearsclub
My YouTube channel: youtube.com/channel/UC537A
My Indicator details:
docs.google.com/document/d/17wUSbSJEZR6rTNVdwqLEBaKM-CSYx-61TN0qazvsnAQ/edit?usp=sharing
免責聲明
這些資訊和出版物並非旨在提供,也不構成TradingView提供或認可的任何形式的財務、投資、交易或其他類型的建議或推薦。請閱讀使用條款以了解更多資訊。