Large Volume Orders [Advanced Dynamic]
📊 Large Volume Orders - Advanced Dynamic Bubble Indicator
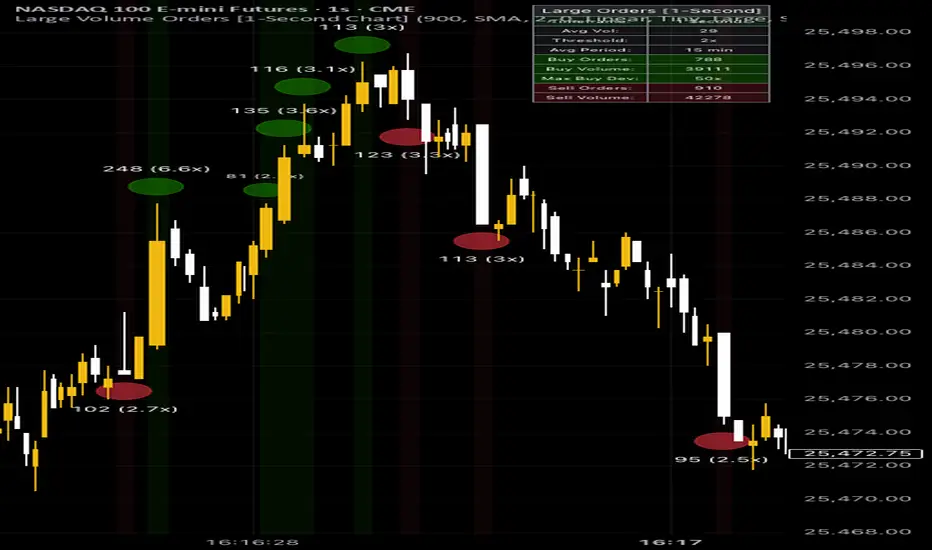
Visualizes institutional-sized orders with intelligent, context-aware bubble displays that scale dynamically based on volume deviation from market averages.
🎯 What It Does:
Detects large volume spikes and displays circular bubbles on your chart
Green bubbles above bars = Buy pressure (bullish candles with high volume)
Red bubbles below bars = Sell pressure (bearish candles with high volume)
Bubble size scales automatically based on how much volume exceeds the rolling average
Session-aware analysis - separate calculations for Pre/Regular/Post market hours
⚙️ Key Settings to Adjust:
1. Lower Timeframe Data
Set "Delta Volume Timeframe" (1s-60s) for granular detection
Works best with 5s or 10s for active markets
2. Volume Threshold
"Volume Multiplier" (default 2.0x) - shows bubbles when volume exceeds 2x the average
Lower = more bubbles (sensitive), Higher = fewer bubbles (only extremes)
3. Dynamic Sizing
"Scaling Method":
Linear = proportional sizing (2x vol = 2x size)
Logarithmic = compressed scaling (better for extreme values)
Set min/max bubble sizes to control visual range
4. Average Calculation
"Average Calculation Period" (5-120 min) - baseline for comparison
Try 15 min for intraday, 30 min for swing trading
Choose SMA/EMA/WMA based on preference
5. Session Settings
Enable "Session-Aware Calculation" for US markets
Use "Custom Session Times" if trading non-US hours
Select your timezone
💡 Quick Start:
Add indicator to chart
Set Volume Multiplier to 2.0x (moderate sensitivity)
Set Average Period to 15 minutes
Enable Dynamic Sizing with Linear scaling
Adjust threshold up/down based on bubble frequency
Go with the cursor on a bubble, to check, if the calculation is correct.
📈 Best For:
Day traders identifying institutional activity
Scalpers finding high-volume entry/exit points
Order flow analysis
Detecting accumulation/distribution zones
Statistics table (top-right) shows real-time counts and max deviations. Status indicator confirms active settings.
⚖️ LEGAL DISCLAIMERNOT FINANCIAL ADVICE | FOR EDUCATIONAL PURPOSES ONLY
This indicator is provided solely for educational and informational purposes. It is NOT intended to be, and should NOT be construed as:
Financial advice
Investment advice
Trading advice
Any recommendation to buy, sell, or hold any security or financial instrument
Important Notices:
Past performance does not guarantee future results
Trading and investing involve substantial risk of loss
You may lose some or all of your invested capital
Only trade with money you can afford to lose
The indicator shows historical volume patterns and does NOT predict future price movements
Volume analysis is one tool among many and should not be used in isolation
This indicator does NOT access real order book data - it analyzes executed volume only
User Responsibility:
You are solely responsible for your own trading and investment decisions
Always conduct your own research and due diligence
Consult with a qualified financial advisor before making investment decisions
The creator of this indicator assumes no liability for any losses incurred from its use
By using this indicator, you acknowledge and accept all risks associated with trading
No Guarantee:
This indicator is provided "as is" without warranty of any kind
No guarantee of accuracy, reliability, or profitability
Market conditions change and indicator performance may vary
Risk Warning: Trading stocks, options, futures, forex, and other financial instruments carries a high level of risk and may not be suitable for all investors. The high degree of leverage can work against you as well as for you.USE AT YOUR OWN RISK. TRADE RESPONSIBLY. 🚨
New Features:
✅ Delta Volume Mode - Calculates buy pressure (close > open) vs sell pressure (close < open)
✅ Proper Timeframe Comparison - Compares 30s delta to 30s average (apples to apples)
✅ Toggle Option - "Use Delta Volume" checkbox to switch between delta and raw volume
✅ Enhanced Tooltips - Shows which mode is active (Delta vs Raw)
## What Changed
This indicator has been **optimized for 1-second chart timeframes only** to address fundamental limitations in Pine Script's data access capabilities.
### Changes Made:
- **Removed lower timeframe functionality** - The indicator no longer attempts to request data from sub-chart timeframes
- **Simplified to chart-native volume** - Now uses only the volume data from the timeframe you're viewing
- **Fixed syntax errors** - Corrected multi-line ternary operators that caused compilation errors
- **Optimized settings** - Adjusted default parameters for 1-second chart usage
---
## ⚠️ CRITICAL USAGE REQUIREMENTS
### 1. **USE ONLY ON TICK CHARTS OR 1-SECOND CHARTS**
This indicator is designed to work **exclusively on tick or 1-second timeframe charts**. Using it on any other timeframe (1min, 5min, etc.) will produce **inaccurate and inconsistent results**.
**Why?** Pine Script's `request.security()` function cannot enumerate all lower timeframe bars - it only samples data. This means:
- On a 1-minute chart requesting 1-second data: You only see ~1 sample per minute (not all 60 seconds)
- On a 5-minute chart requesting 1-second data: You only see ~1 sample per 5 minutes (not all 300 seconds)
- Different chart timeframes will show **completely different bubbles** for the same time period
### 2. **TICK DATA LIMITATIONS**
While TradingView does provide tick charts (available for **Premium users only**), there are significant limitations:
**What is "tick volume"?**
- Tick volume counts **price changes**, not actual traded volume
- Each "tick" represents a price update, regardless of how many contracts/shares traded
- There is a strong correlation between tick volume and real volume, but it's an **indirect estimate**
**Key Issues:**
- **Not true volume** - Tick volume ≠ actual traded volume
- **Broker discrepancies** - Volume data varies significantly between brokers/exchanges
- **Data feed differences** - Different providers aggregate data differently
- **Missing trades** - Not every individual trade is captured, only price updates
**Bottom line:** Even with tick data access, you're still working with estimates, not definitive order flow.
### 3. **REPAINTING BEHAVIOR ON HIGHER TIMEFRAMES**
If you attempt to use this indicator on timeframes larger than 1-second:
**What happens:**
- Bubbles appear and disappear in real-time as the bar develops
- The indicator shows different results on 1min vs 5min vs 15min charts for the same time
- Historical bubbles won't match what appeared in real-time
**Why this happens:**
- `request.security()` samples lower timeframe data inconsistently
- Each chart timeframe gets different "snapshots" of the lower timeframe
- Real-time bars show temporary values that change with each data feed update
- Historical bars only show final confirmed values
**This is a fundamental limitation of Pine Script**, not a bug. There is no reliable way to capture all sub-bar volume spikes on higher timeframes using Pine Script's current architecture.
---
## Recommended Setup
**For best results, use tick charts (Premium users only) or 1-second charts:**
1. **Switch to tick chart or 1-second chart** in TradingView
2. **Adjust "Average Period"** - Default is 900 seconds (15 minutes)
3. **Set "Volume Multiplier"** - Start with 2.0, lower to 1.5-1.0 for more sensitivity
4. **Enable "Use Delta Volume"** - Shows directional buying/selling pressure
**Note:** Tick charts provide more granular data but remember that tick volume is not the same as actual traded volume.
---
## Data Accuracy Disclaimer
Even on tick or 1-second charts, the accuracy of volume detection depends on:
- **Exchange data feed quality and latency**
- **TradingView's data aggregation methods**
- **Broker-to-broker volume discrepancies** - Different brokers report different volume data
- **Tick volume vs real volume** - Tick volume is an indirect estimate based on price changes
- **Real-time vs historical data discrepancies**
**Important:** Volume data can vary significantly between brokers and data providers. What appears as a "large order" on one broker's feed may not appear the same on another.
For **true institutional order flow analysis**, consider:
- Professional market depth/DOM platforms with Level 2 data
- Direct exchange market data feeds
- Order book analysis tools
- Time & Sales data from exchange sources
---
## Conclusion
This indicator provides **approximate large order detection** on tick or 1-second charts only. It is not suitable for timeframes >1 second due to Pine Script limitations.
**Key Limitations to Understand:**
- Tick volume ≠ actual traded volume (it's an indirect estimate)
- Volume data varies between brokers and data providers
- Not suitable for detecting actual institutional order flow
- Best used as a supplementary tool alongside other analysis
**If you need reliable institutional order flow data, use dedicated platforms with:**
- Direct exchange feeds
- Level 2 / Depth of Market data
- True time & sales execution data
- Professional order flow tools
僅限邀請腳本
Only users approved by the author can access this script. You'll need to request and get permission to use it. This is typically granted after payment. For more details, follow the author's instructions below or contact Traderoptionandi directly.
TradingView does NOT recommend paying for or using a script unless you fully trust its author and understand how it works. You may also find free, open-source alternatives in our community scripts.
作者的說明
免責聲明
僅限邀請腳本
Only users approved by the author can access this script. You'll need to request and get permission to use it. This is typically granted after payment. For more details, follow the author's instructions below or contact Traderoptionandi directly.
TradingView does NOT recommend paying for or using a script unless you fully trust its author and understand how it works. You may also find free, open-source alternatives in our community scripts.