OPEN-SOURCE SCRIPT
Composite Scaled EMA Levels
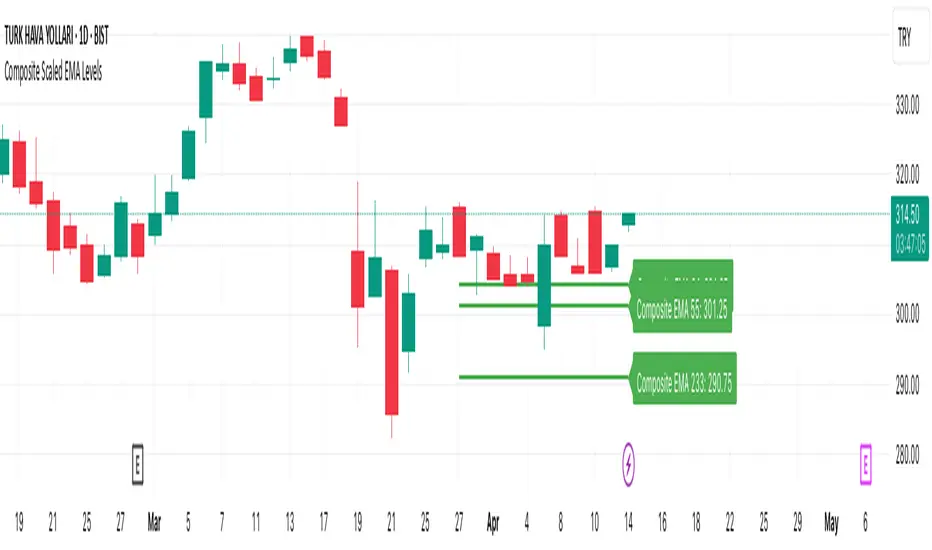
Composite Scaled EMA Levels Indicator
This TradingView Pine Script indicator calculates a “composite EMA” that compares the closing price of the current asset with that of the XU100 index and scales the EMA values to the XU100 level. It then visualizes these computed levels as horizontal lines on the chart with corresponding labels.
Key Components:
Inputs and Data Retrieval:
Length Input: The user defines a parameter length (default is 10) which determines over how many bars the horizontal line is drawn.
Data Collection:
The daily closing price of the current symbol (current_close) is retrieved using request.security().
The daily closing price of the XU100 index (xu100) is also retrieved.
A ratio is computed as current_close / xu100. This ratio serves as the basis for calculating the composite EMAs.
EMA Calculations:
The indicator computes Exponential Moving Averages (EMAs) on the ratio for specific periods.
In the provided version, the script calculates EMAs for three periods (34, 55, and 233), though you can easily expand this to other periods if needed.
Each computed EMA (for instance, EMA34, EMA55, EMA233) is then scaled by multiplying it with the XU100 index’s close, converting it to a price level that is meaningful on the chart.
Drawing Horizontal Lines:
Instead of using the standard plot() function, the script uses line.new() to draw horizontal lines representing the scaled EMA values over the last “length” bars.
Before drawing new lines, any existing lines and labels are deleted to ensure that only the most current values are shown.
Adding Labels to Lines:
The script creates a label for each EMA using label.new(), placing the label at the current bar (i.e., the rightmost position on the chart) using label.style_label_left so that the text appears to the right of the line.
The label displays the name of the composite EMA (e.g., "Composite EMA 34") along with its current scaled value.
Visualization:
The horizontal lines and labels provide a visual reference for the composite EMA levels. These lines help traders see critical support/resistance levels derived from the relationship between the current asset and the XU100 index.
Colors are assigned for clarity (for example, the EMA lines in this version use green).
Summary:
The Composite Scaled EMA Levels indicator is designed to help traders analyze the relationship between an asset’s price and the broader market index (XU100) by calculating a ratio and then applying EMAs on that ratio. By scaling these EMAs back to price levels and displaying them as horizontal lines with clear labels on the chart, the indicator offers a visual tool to assess trend direction and potential support or resistance levels. This can assist in making informed trading decisions based on composite trend analysis.
開源腳本
秉持TradingView一貫精神,這個腳本的創作者將其設為開源,以便交易者檢視並驗證其功能。向作者致敬!您可以免費使用此腳本,但請注意,重新發佈代碼需遵守我們的社群規範。
免責聲明
這些資訊和出版物並非旨在提供,也不構成TradingView提供或認可的任何形式的財務、投資、交易或其他類型的建議或推薦。請閱讀使用條款以了解更多資訊。
免責聲明
這些資訊和出版物並非旨在提供,也不構成TradingView提供或認可的任何形式的財務、投資、交易或其他類型的建議或推薦。請閱讀使用條款以了解更多資訊。