OPEN-SOURCE SCRIPT
Oliver Velez Indicator
Oliver Velez is a well-known trader and educator who has developed multiple trading strategies. One of them is the 20-200sma strategy, which is a basic moving average crossover strategy. The strategy involves using two simple moving averages (SMAs) - a short-term SMA with a period of 20 and a long-term SMA with a period of 200 - on a 2-minute timeframe chart.
When the short-term SMA crosses above the long-term SMA, it signals a potential bullish trend and traders may look for opportunities to enter a long position. Conversely, when the short-term SMA crosses below the long-term SMA, it signals a potential bearish trend and traders may look for opportunities to enter a short position.
Traders using this strategy may also look for additional confirmations, such as price action signals or other technical indicators, before entering or exiting a trade. It is important to note that no trading strategy can guarantee profits, and traders should always use risk management techniques to limit potential losses.
This script is an implementation of the 2 SMA's (can also choose other types of MA's), with Elephant Bar Indicator (EBI) and the Tail Bars Indicator in TradingView.
The Elephant Bar Indicator is a technical indicator used in trading to identify potential trend reversals in the market. It is named after the large size of the bullish or bearish candlestick that it represents. The Tail Bars Indicator is a pattern recognition technique that identifies candlestick patterns with long tails or wicks.
The script starts by defining the input parameters for both indicators. For the Elephant Bar Indicator, the user inputs the lookback period and the size multiplier. For the Tail Bars Indicator, the user inputs the tail ratio and opposite wick ratio.
Next, the script calculates the moving averages of the closing price over the defined short and long periods using the Moving Average function. The script then calculates the average candle size and volume over the lookback period.
The script then identifies the Elephant Bars and Tail Bars using the input parameters and additional conditions. For Elephant Bars, the script identifies bullish and bearish bars that meet certain criteria, such as a size greater than the average candle size and volume greater than the average volume.
For Tail Bars, the script identifies bullish and bearish bars that have long tails or wicks and meet certain criteria such as opposite wick size less than or equal to the tail size multiplied by the input opposite wick ratio.
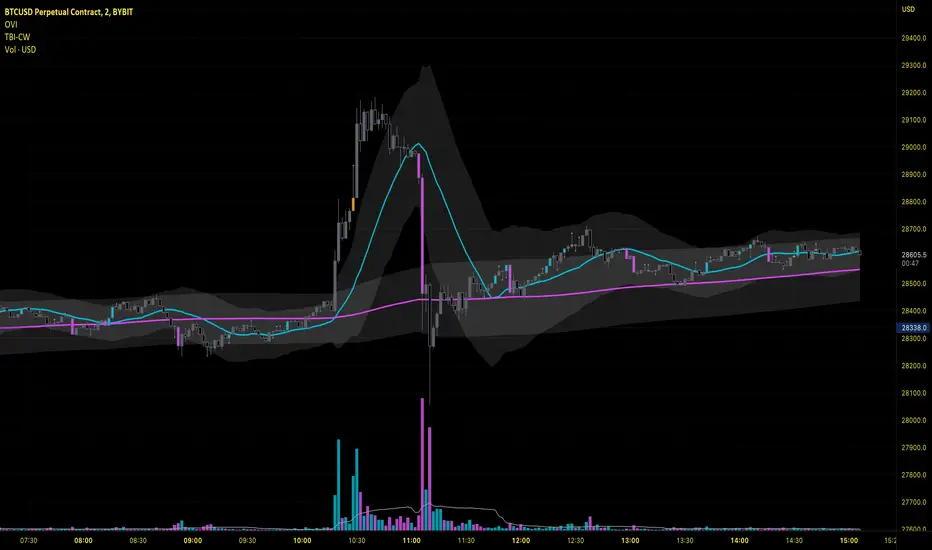
Finally, the script plots the Elephant Bar and Tail Bar signals on the chart using different colors and shapes. The script also plots the moving averages and Keltner Channels to help traders identify potential trend reversals.
It is still under development, so please, if someone has ideas to add, more than welcome
When the short-term SMA crosses above the long-term SMA, it signals a potential bullish trend and traders may look for opportunities to enter a long position. Conversely, when the short-term SMA crosses below the long-term SMA, it signals a potential bearish trend and traders may look for opportunities to enter a short position.
Traders using this strategy may also look for additional confirmations, such as price action signals or other technical indicators, before entering or exiting a trade. It is important to note that no trading strategy can guarantee profits, and traders should always use risk management techniques to limit potential losses.
This script is an implementation of the 2 SMA's (can also choose other types of MA's), with Elephant Bar Indicator (EBI) and the Tail Bars Indicator in TradingView.
The Elephant Bar Indicator is a technical indicator used in trading to identify potential trend reversals in the market. It is named after the large size of the bullish or bearish candlestick that it represents. The Tail Bars Indicator is a pattern recognition technique that identifies candlestick patterns with long tails or wicks.
The script starts by defining the input parameters for both indicators. For the Elephant Bar Indicator, the user inputs the lookback period and the size multiplier. For the Tail Bars Indicator, the user inputs the tail ratio and opposite wick ratio.
Next, the script calculates the moving averages of the closing price over the defined short and long periods using the Moving Average function. The script then calculates the average candle size and volume over the lookback period.
The script then identifies the Elephant Bars and Tail Bars using the input parameters and additional conditions. For Elephant Bars, the script identifies bullish and bearish bars that meet certain criteria, such as a size greater than the average candle size and volume greater than the average volume.
For Tail Bars, the script identifies bullish and bearish bars that have long tails or wicks and meet certain criteria such as opposite wick size less than or equal to the tail size multiplied by the input opposite wick ratio.
Finally, the script plots the Elephant Bar and Tail Bar signals on the chart using different colors and shapes. The script also plots the moving averages and Keltner Channels to help traders identify potential trend reversals.
It is still under development, so please, if someone has ideas to add, more than welcome
開源腳本
秉持TradingView一貫精神,這個腳本的創作者將其設為開源,以便交易者檢視並驗證其功能。向作者致敬!您可以免費使用此腳本,但請注意,重新發佈代碼需遵守我們的社群規範。
免責聲明
這些資訊和出版物並非旨在提供,也不構成TradingView提供或認可的任何形式的財務、投資、交易或其他類型的建議或推薦。請閱讀使用條款以了解更多資訊。
開源腳本
秉持TradingView一貫精神,這個腳本的創作者將其設為開源,以便交易者檢視並驗證其功能。向作者致敬!您可以免費使用此腳本,但請注意,重新發佈代碼需遵守我們的社群規範。
免責聲明
這些資訊和出版物並非旨在提供,也不構成TradingView提供或認可的任何形式的財務、投資、交易或其他類型的建議或推薦。請閱讀使用條款以了解更多資訊。