OPEN-SOURCE SCRIPT
已更新 Velas Envolventes + RSI / Stttrading F.Velazquez
Engulfing Candle + RSI Indicator by Stttrading F.Velazquez
Description:
Discover a powerful tool for market analysis with the Velas Engulfing + RSI Indicator. Crafted by Stttrading Franco Velazquez, this indicator seamlessly blends engulfing candle patterns with the precision of the RSI filter. What sets it apart is its unique approach – signals are exclusively generated when the RSI reaches overbought or oversold conditions, providing a distinctive edge over conventional engulfing candle indicators.

Key Features:
Engulfing Candle Patterns: Identify both bullish and bearish engulfing candle formations.
RSI Integration: Harness the strength of the RSI indicator to evaluate market momentum and potential reversals.
Visual Signals: Enjoy clear and intuitive signals directly on your chart for seamless decision-making.
Configurable Alerts: Tailor the indicator to your preferences with customizable alerts for timely notifications.
Usage Instructions:
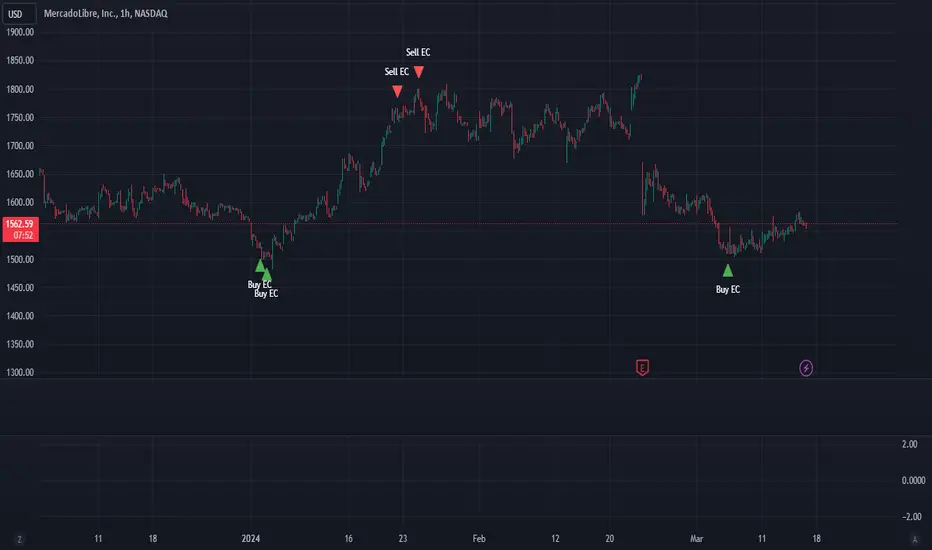
Engulfing Candles:
Visualize bullish and bearish candles through green and red triangles, respectively.
Capitalize on buying opportunities when bullish candles emerge and consider selling when bearish candles unfold.
RSI Indicator:
Leverage the RSI indicator to gauge overbought and oversold market conditions.
Fine-tune RSI levels based on your trading strategy and risk tolerance.

Alert System:
Set up alerts to stay informed about crucial market movements, ensuring you never miss a trading opportunity.
Custom Configuration:
RSI Source: Customize the data source for RSI calculations to suit your analysis.
RSI Length: Define the length of the RSI period for precise adjustments.
RSI Overbought and Oversold Levels: Tailor the overbought and oversold RSI thresholds to align with your trading preferences.
Important Note: Always conduct thorough analysis and implement proper risk management before executing trades.
Version 3.13.2
Designed and Developed by Stttrading Franco Velazquez
Description:
Discover a powerful tool for market analysis with the Velas Engulfing + RSI Indicator. Crafted by Stttrading Franco Velazquez, this indicator seamlessly blends engulfing candle patterns with the precision of the RSI filter. What sets it apart is its unique approach – signals are exclusively generated when the RSI reaches overbought or oversold conditions, providing a distinctive edge over conventional engulfing candle indicators.
Key Features:
Engulfing Candle Patterns: Identify both bullish and bearish engulfing candle formations.
RSI Integration: Harness the strength of the RSI indicator to evaluate market momentum and potential reversals.
Visual Signals: Enjoy clear and intuitive signals directly on your chart for seamless decision-making.
Configurable Alerts: Tailor the indicator to your preferences with customizable alerts for timely notifications.
Usage Instructions:
Engulfing Candles:
Visualize bullish and bearish candles through green and red triangles, respectively.
Capitalize on buying opportunities when bullish candles emerge and consider selling when bearish candles unfold.
RSI Indicator:
Leverage the RSI indicator to gauge overbought and oversold market conditions.
Fine-tune RSI levels based on your trading strategy and risk tolerance.
Alert System:
Set up alerts to stay informed about crucial market movements, ensuring you never miss a trading opportunity.
Custom Configuration:
RSI Source: Customize the data source for RSI calculations to suit your analysis.
RSI Length: Define the length of the RSI period for precise adjustments.
RSI Overbought and Oversold Levels: Tailor the overbought and oversold RSI thresholds to align with your trading preferences.
Important Note: Always conduct thorough analysis and implement proper risk management before executing trades.
Version 3.13.2
Designed and Developed by Stttrading Franco Velazquez
發行說明
Enhanced Visual Signals Indicator - Version UpdateWe are pleased to announce a visual enhancement to the "Bullish Engulfing + RSI" indicator by Stttrading F.Velazquez. The latest version focuses on refining the visual elements of the trading signals for a more aesthetically pleasing experience.
Key Visual Improvements:
Signal Representation:
The buy and sell signals have been visually refined with sleek triangles for a cleaner and more polished appearance on the chart.
Text Presentation:
The accompanying text for signals has undergone adjustments in size and placement, ensuring improved visibility without cluttering the chart.
These visual enhancements aim to provide a more user-friendly and visually appealing trading experience. We believe that these updates will contribute to a better overall chart presentation.
Thank you for your continued support, and we hope you find these visual improvements valuable in your trading activities.
發行說明
We have updated our indicator to Pine Script v5, as the previous version was obsolete. We performed this update to ensure optimal performance and take advantage of the new features available. Thank you for your continued support, and we hope you enjoy the latest version.發行說明
Update Announcement: Enhanced Features and Additional AdditionsDear Users,
We've heard your feedback and are pleased to announce an update to our indicator with some new features.
What's New:
Harami Candles Enhancement:
Activate or deactivate Harami candles with a convenient checkbox, giving you control over their visibility in your analysis.
Independent RSI Settings for Harami:
Customize RSI parameters specifically for Harami candles. Tailor your indicator settings to match your unique trading preferences.
Upcoming Additions:
Stay tuned for upcoming features, including:
-Hammer Candles
-Shooting Star Candles
-Signal Filtering to clean up past and repetitive signals, ensuring a cleaner and more visually appealing chart.
We hope these enhancements improve your trading experience. As always, feel free to reach out if you have any questions.
Happy trading!
發行說明
We're pleased to inform you that we have added the Shooting Star (SS) and Hammer (HMM) candlestick patterns to the indicator. Thank you for the positive feedback!發行說明
Dear users,I'm pleased to announce that I've updated the highly praised indicator. It now includes information about myself, the creator, for greater transparency. I invite you to follow me on my investment social media platforms, where we've created a new investor account solely for using this indicator to project results, obviously with my intellectual filter.
I sincerely appreciate your positive feedback and your interest in keeping the indicator free for everyone.
Best regards,
Velázquez Franco, sttTrading.
發行說明
We have made minor changes to the indicator; these do not affect its performance but improve its code readability.發行說明
The free and public version of the indicator is created and renamed to 'PATTERNPULSE' in its FREE VERSION. You can access the paid version, which includes 12 additional indicators such as Bollinger Bands, EMA, MA, Volume Profile, support and resistance levels, and more.發行說明
Improvement in the settings menu for a more user-friendly view.發行說明
Hey dear traders! We're continuing to improve the indicator.Even though we've been focused on the paid version over the past few months, we haven't lost sight of the free version and are constantly thinking about its enhancements.
In this case, we've included a volume filter— a simple tool that helps reduce false signals on the chart (we took this idea from your constant feedback). As a result, the signals are now fewer, which cleans up the chart and makes them more effective. Thank you for continuing to use our indicator!
發行說明
A checkbox was added to activate or deactivate the volume filter.開源腳本
秉持TradingView一貫精神,這個腳本的創作者將其設為開源,以便交易者檢視並驗證其功能。向作者致敬!您可以免費使用此腳本,但請注意,重新發佈代碼需遵守我們的社群規範。
免責聲明
這些資訊和出版物並非旨在提供,也不構成TradingView提供或認可的任何形式的財務、投資、交易或其他類型的建議或推薦。請閱讀使用條款以了解更多資訊。
開源腳本
秉持TradingView一貫精神,這個腳本的創作者將其設為開源,以便交易者檢視並驗證其功能。向作者致敬!您可以免費使用此腳本,但請注意,重新發佈代碼需遵守我們的社群規範。
免責聲明
這些資訊和出版物並非旨在提供,也不構成TradingView提供或認可的任何形式的財務、投資、交易或其他類型的建議或推薦。請閱讀使用條款以了解更多資訊。