OPEN-SOURCE SCRIPT
Multi-Timeframe MA - TCMaster
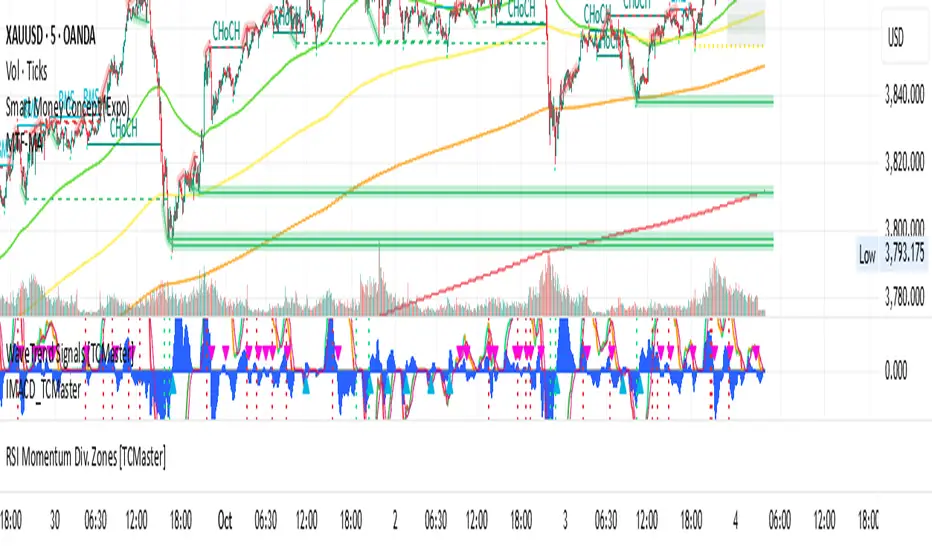
🧩 Overview
This indicator displays up to four moving averages from different timeframes on a single chart.
It’s designed for traders who want to track higher-timeframe trends while analyzing price action on lower timeframes — a key technique in multi-timeframe confluence trading.
You can freely customize the type, length, timeframe, and color for each moving average line.
⚙️ Features
4 configurable Moving Averages (each with its own type, length, and timeframe).
Supported types:
SMA, EMA, WMA, RMA, HMA, VWMA, DEMA, TEMA.
Real-time values are fetched from higher timeframes using request.security() (no repaint).
Individual visibility toggle and line width for each MA.
Dynamic info label shows current distance between price and each MA.
Built with Pine Script v6, ensuring optimal performance and flexibility.
📊 Typical Use Cases
Identify trend direction across multiple timeframes.
Confirm entries/exits using higher timeframe trend alignment.
Spot potential reversal or continuation zones when short-term price interacts with long-term MAs.
Build confluence setups for swing, scalp, or intraday strategies.
🧠 Example Setup
MA Type Length Timeframe Purpose
MA #1 SMA 200 1m Micro trend
MA #2 EMA 200 5m Short-term trend
MA #3 EMA 200 15m Medium trend
MA #4 SMA 200 30m Macro trend
🔔 Tips
Combine with oscillators (e.g., RSI, Stoch, MACD) for stronger confluence.
Use color coding to distinguish short vs long timeframe trends.
Consider adding alerts when price crosses any MA (can be extended easily in code).
⚠️ Notes
All higher-timeframe data is handled safely using lookahead=barmerge.lookahead_off to prevent repainting.
Label updates only on the latest bar for efficiency.
VWMA, DEMA, TEMA, and HMA are computed via internal formulas for compatibility with Pine Script v6.
🏁 Summary
Multi-Timeframe MA is a powerful tool for traders who want to merge the clarity of moving averages with the precision of multi-timeframe analysis.
It helps you see the bigger picture without switching charts — perfect for intraday, swing, and trend-following strategies.
開源腳本
In true TradingView spirit, the creator of this script has made it open-source, so that traders can review and verify its functionality. Kudos to the author! While you can use it for free, remember that republishing the code is subject to our House Rules.
免責聲明
The information and publications are not meant to be, and do not constitute, financial, investment, trading, or other types of advice or recommendations supplied or endorsed by TradingView. Read more in the Terms of Use.