OPEN-SOURCE SCRIPT
Daily and Weekly Moving Averages on Daily Chart
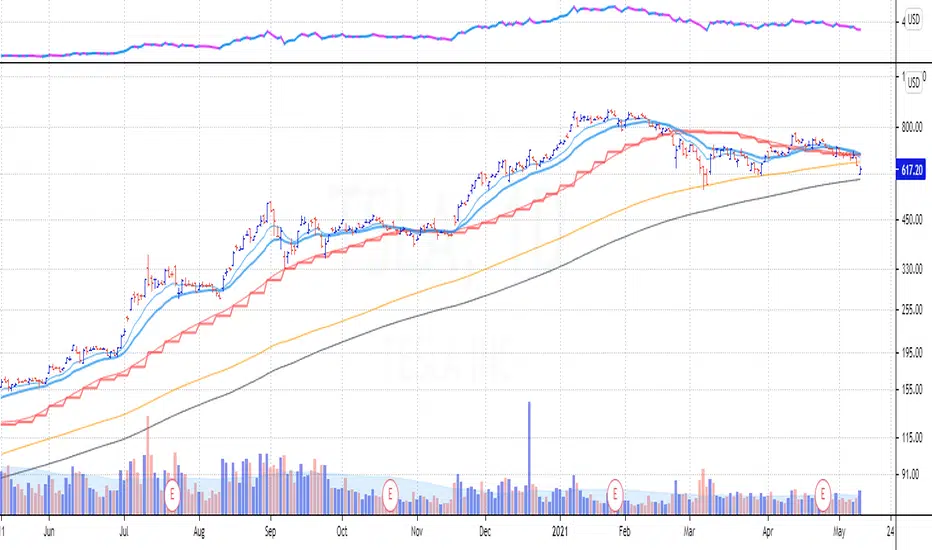
For the long term trend I use the 200 and 150 daily moving averages. The 200-day MA will be plotted as a black line. It is a no-go zone to buy anything trading below that.
The 150-day, or 30-week like Stan Weinstein uses, is plotted in orange.
Than I use the 50 day moving average but also the 10 week moving average. While those look similar there is a small difference which sometimes impacts the choice for selling a stock or holding on to it.
That slight difference is useful in different situations that’s why I want to have them both on my chart.
Both the 50-day and the 10-week are plotted as red lines on the chart. Since there’s only a small difference the same color gives a nicer view.
For shorter term trend I like to use the 20 and 10 day exponential moving averages. I tested these but also the commonly used 21, 9 and some other variations. But came to the conclusion that for me the 20EMA and 10EMA works best.
Both EMA’s are plotted in blue, where the 20EMA has a thicker line to easily see the difference.
開源腳本
秉持TradingView一貫精神,這個腳本的創作者將其設為開源,以便交易者檢視並驗證其功能。向作者致敬!您可以免費使用此腳本,但請注意,重新發佈代碼需遵守我們的社群規範。
免責聲明
這些資訊和出版物並非旨在提供,也不構成TradingView提供或認可的任何形式的財務、投資、交易或其他類型的建議或推薦。請閱讀使用條款以了解更多資訊。
開源腳本
秉持TradingView一貫精神,這個腳本的創作者將其設為開源,以便交易者檢視並驗證其功能。向作者致敬!您可以免費使用此腳本,但請注意,重新發佈代碼需遵守我們的社群規範。
免責聲明
這些資訊和出版物並非旨在提供,也不構成TradingView提供或認可的任何形式的財務、投資、交易或其他類型的建議或推薦。請閱讀使用條款以了解更多資訊。