INVITE-ONLY SCRIPT
Ethereum: Price Action Integral Bands
已更新
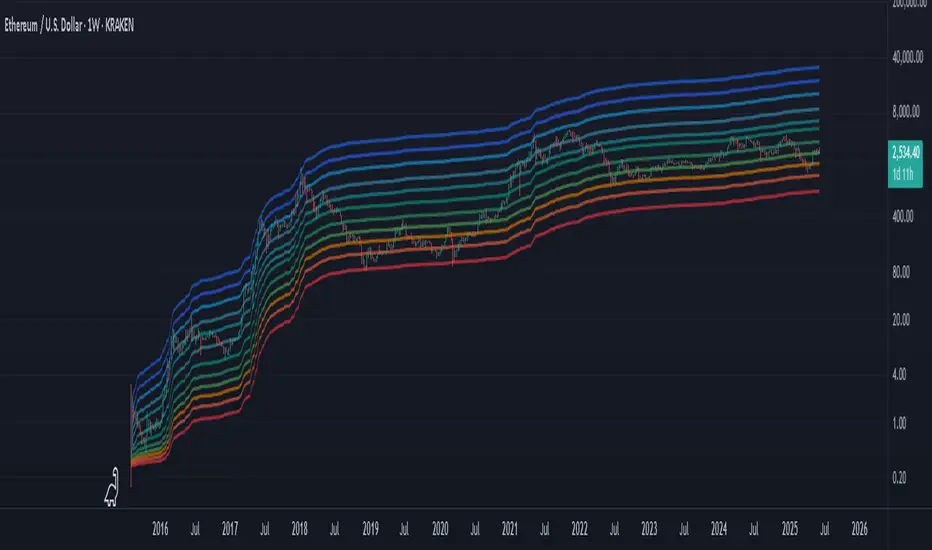
This indicator tries to display absolute tops and bottoms for Ethereum. The price action gets integrated with three custom functions resulting in the blue top, green mid and red bottom price action integrals. From those integral values we allow 5% deviation in up and down direction, leading to price action integral bands of some non-zero width.
Even during the liquidity crisis in March 2020 with abnormal price movements, Ethereum had no daily or weekly candle close below the support band. For longer-term trades it might be a good idea to buy ETH when price is around the red band, and temporarily sell/go short when ETH is around the blue band, although this is no financial advice and one should always cross-check with other indicators/informations.
The green mid price action integral band indicates bullish/bearish zones. When price is located above the green band, the market is in a bullish environment, if price lies below it, the market is in a bearish environment.
There's the option to plot or hide the bands individually.
These integral bands are specifically designed for the Ethereum (ETHUSD) Kraken ticker on daily (D) or weekly (W) timeframe (the indicator automatically adjusts for both those timeframes). For other assets, tickers and timeframes the functionality of this indicator cannot be guaranteed and will most probably not deliver meaningful results. If you want to use the integral bands for Bitcoin, please see my other indicator titled 'Bitcoin: Price Action Integral Bands'.
For access please contact me via DM on TradingView or on Twitter (linked in my TradingView profile and my signature).
發行說明
Updated the mid integral band. Also after review I would recommend to use the daily (D) timeframe for this indicator, as it seems to be more accurate there (better integrating due to finer price action data I assume).發行說明
Tweaked the top integral band to better fit to the general market data (as the 2018 ATH price of the Kraken ETH/USD pair was an outlier compared to other order books).發行說明
Added two more integral bands for finer trading opportunities: a turquoise top-mid band, and an orange bottom-mid band.發行說明
Added a full array of bands for many additional trading opportunities, and especially for a mapping of the parabolic fallout following a bullrun. The idea would be to trade the next parabolic fallout roughly as depicted in the chart below (marked are the relative increases/decreases of each broader move during the fallout):Depending on how this indicator is used, the set up of stop losses is recommended in case no reversal happens at certain bands.
發行說明
Small readjustment update of the 4th band.僅限邀請腳本
僅限作者授權的用戶訪問此腳本,並且通常需要付費。您可以將其增加到收藏腳本中,但是只有在向作者請求並獲得許可之後,才能使用它。 請聯繫Dean_Trader以了解更多信息,或按照下面作者的說明進行操作。
TradingView 不建議購買並使用此腳本,除非您 100% 信任其作者並了解腳本的工作原理。在許多情況下,您可以在我們的社群腳本中免費找到良好的開源替代方案。
作者的說明
″For access please contact me via DM on TradingView or on Twitter (linked in my TradingView profile and my signature).
想在圖表上使用此腳本?
警告:請閱讀,然後再請求訪問權限。
Website (for access to my scripts): deantrader.com
Twitter (for Swing Algo footage): twitter.com/Dean_Trader
Twitter (for Swing Algo footage): twitter.com/Dean_Trader
免責聲明
這些資訊和出版物並不意味著也不構成TradingView提供或認可的金融、投資、交易或其他類型的意見或建議。請在使用條款閱讀更多資訊。