OPEN-SOURCE SCRIPT
First Candle Channel
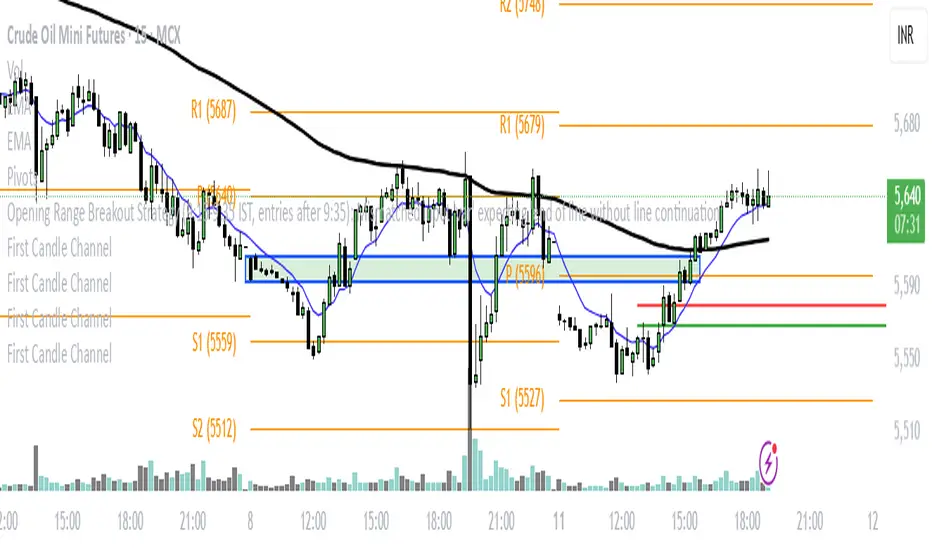
To create a price channel on the 15-minute timeframe based on the first candle's highest and lowest points, follow these steps:
Identify the first 15-minute candle of the trading session or your observation period.
Note the high and low prices of this first candle.
Draw two horizontal lines on the chart:
The upper line at the highest price of the first candle.
The lower line at the lowest price of the first candle.
These two lines form the channel boundaries for subsequent price action.
You can use this channel to observe price movement, noting when price breaks above (bullish breakout) or below (bearish breakdown) the channel formed by the first candle.
This method creates a simple visual range reference based on the initial price movement of the session or period, often used to gauge early strength or rarity of breakout events.
開源腳本
秉持TradingView一貫精神,這個腳本的創作者將其設為開源,以便交易者檢視並驗證其功能。向作者致敬!您可以免費使用此腳本,但請注意,重新發佈代碼需遵守我們的社群規範。
免責聲明
這些資訊和出版物並非旨在提供,也不構成TradingView提供或認可的任何形式的財務、投資、交易或其他類型的建議或推薦。請閱讀使用條款以了解更多資訊。
開源腳本
秉持TradingView一貫精神,這個腳本的創作者將其設為開源,以便交易者檢視並驗證其功能。向作者致敬!您可以免費使用此腳本,但請注意,重新發佈代碼需遵守我們的社群規範。
免責聲明
這些資訊和出版物並非旨在提供,也不構成TradingView提供或認可的任何形式的財務、投資、交易或其他類型的建議或推薦。請閱讀使用條款以了解更多資訊。