OPEN-SOURCE SCRIPT
已更新 Initial Balance (IB) and Previous Day / Week High, Low & Close
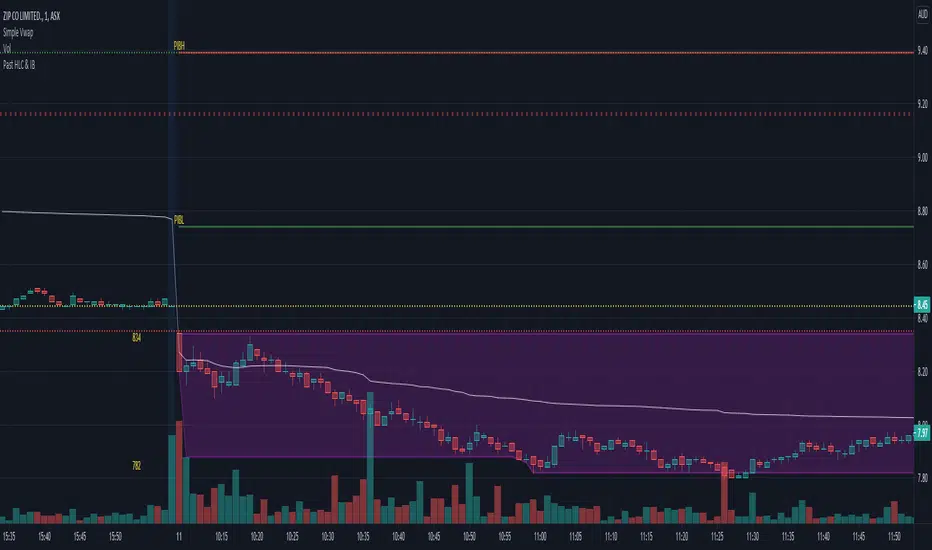
Plots Historical key levels for volume profile idea.
Plots the following:
- Previous Day High
- Previous Day Low
- Previous Day Close
- Previous Day IB High
- Previous Day IB Low
- Current Days IB High
- Current Days IB Low
IB is based on first hour of trading.
Made specifically for ASX stocks, have not tested it on other exchanges or assets.
Plots the following:
- Previous Day High
- Previous Day Low
- Previous Day Close
- Previous Day IB High
- Previous Day IB Low
- Current Days IB High
- Current Days IB Low
IB is based on first hour of trading.
Made specifically for ASX stocks, have not tested it on other exchanges or assets.
發行說明
Fixed bugsThe indicator will now create a IB area for the current day, and shade it, and store details of previous days IB session and display it as a plot line.
Historical IB's can be switched on and viewed via settings.
IB session length can be altered in the settings.
發行說明
Just updated how high and low is sourced for IB so that its real price, and is not effected by changing to Heikin ashi candles, or others. 發行說明
updated error in IB being updated all day rather than just IB time. 發行說明
Updated and cleaned up the IB indicator開源腳本
秉持TradingView一貫精神,這個腳本的創作者將其設為開源,以便交易者檢視並驗證其功能。向作者致敬!您可以免費使用此腳本,但請注意,重新發佈代碼需遵守我們的社群規範。
免責聲明
這些資訊和出版物並非旨在提供,也不構成TradingView提供或認可的任何形式的財務、投資、交易或其他類型的建議或推薦。請閱讀使用條款以了解更多資訊。
免責聲明
這些資訊和出版物並非旨在提供,也不構成TradingView提供或認可的任何形式的財務、投資、交易或其他類型的建議或推薦。請閱讀使用條款以了解更多資訊。