DTC Initial Balance ProWHAT THIS DOES
Every trading session has an "Initial Balance" — the first chunk of time
after the open (default: the first hour, 09:30-10:30 New York) where the
market sets its early high and low. Traders have long believed that
WHICH ONE FORMS FIRST — the high or the low — hints at which way the
rest of the day tends to go.
The problem: on a normal chart, you can't actually tell which came
first just by looking at a candle. A single 15-minute or 1-hour candle
can have both a new high AND a new low in it, and the candle's color
tells you nothing about the order they happened in.
This indicator solves that by secretly rebuilding the entire session
minute-by-minute in the background (even if your chart is on 15m, 1H,
or Daily), so it can tell you EXACTLY which one happened first — based
on real timestamps, never a guess.
HOW TO READ IT
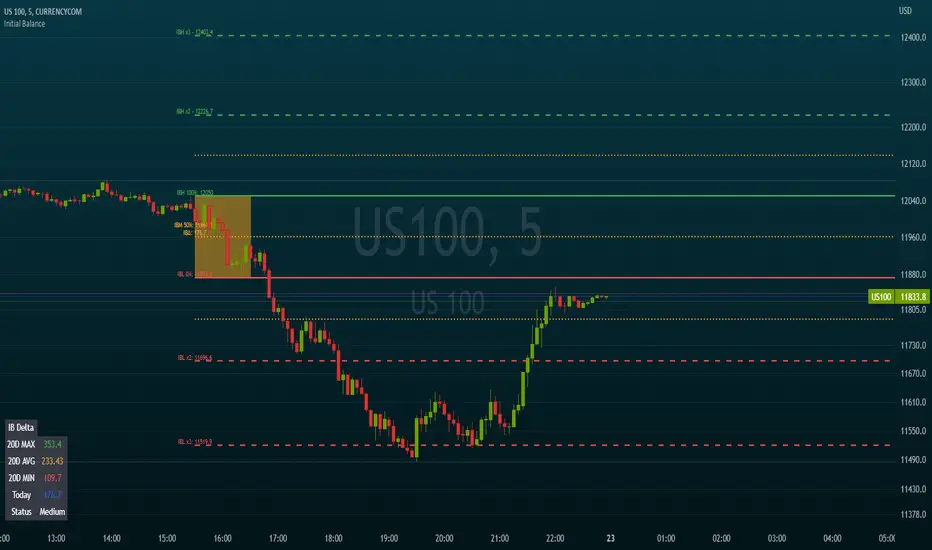
- A colored box appears over the session: green means the low formed
first, red means the high formed first. Gray means it's still
forming.
- A small label shows the result once the session ends.
- A table (top-right by default) shows the full breakdown: exact
prices, exact times, and a "Bias" (Long/Short) reading.
THE PART THAT MAKES THIS DIFFERENT
Most tools stop at "which formed first." This one keeps going and
actually checks your chart's history to answer the follow-up question:
"okay, but does that actually mean anything?" It tracks, for every
past session, what price did AFTERWARD — did it break above the
session high, or below the session low — and shows you the real
percentages. So instead of trusting a rule of thumb, you can see
whether it's actually held up on the exact symbol and timeframe you
trade.
It also projects price targets above and below the session (simple
multiples of the session's range) and shows how often price has
historically reached each one.
FEATURES
- Works on any chart timeframe - internally always reconstructed from
1-minute (or 5-minute, for older history) data
- Fully customizable session times, not locked to the NY open
- Adjustable colors, box/line styles, and label sizes
- A statistics table with three sections: current session detail,
all-time stats, and post-session breakout odds
- Price target lines (+0.5x to +3.0x the session range) with their own
historical hit-rate table
- Alerts for session completion and for each outcome
- No repainting - once a session ends, its result is permanently frozen
A NOTE ON HONESTY
This indicator will tell you "Simultaneous" instead of guessing when
the high and low happen too close together to tell apart (this is a
hard limit of how granular historical data can get, not a shortcut).
Older history beyond what 1-minute data allows automatically falls back
to 5-minute reconstruction, clearly labeled in the table so you always
know the precision you're looking at.
This is an analytical tool for understanding market structure, not financial advice.
Historical statistics describe the past
they are not a guarantee of future behavior.
指標

Initial Balance Breakout [samjNQ] v3---samjNQ Initial Balance Breakout strategy---
**Initial Balance Breakout — Strategy Description**
Trades breakouts of the first-hour Initial Balance on the Micro E-mini S&P 500 (MES1!) using a clean set of filters to avoid noise and low-quality setups.
**How it works:**
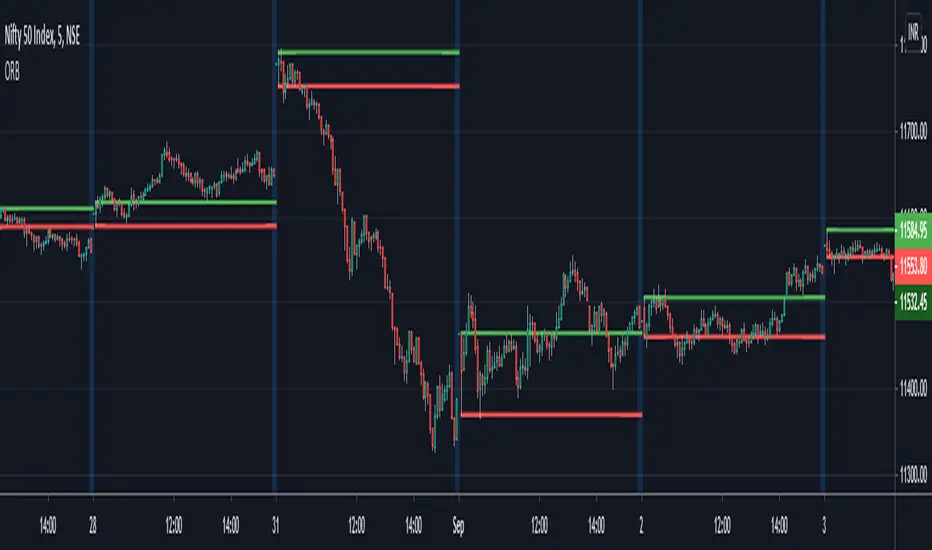
The Initial Balance (IB) is defined as the high and low of the 9:30–10:30 AM ET window — the first hour of Regular Trading Hours. Once that window closes and the IB locks, the strategy waits for price to break above the IB High (long) or below the IB Low (short) during the trade window (10:30 AM–2:30 PM ET).
**Filters applied:**
- **VWAP trend filter** — only takes long breakouts when price is above VWAP, and short breakouts when price is below. Avoids trading against intraday momentum.
- **IB range filter** — skips days where the IB is too narrow (choppy, commissions eat returns) or too wide (extensions become unreachable). Configurable min/max in points.
- **2:30 PM cutoff** — no new entries in the last 90 minutes of the session. Late breakouts rarely have time to reach targets.
- **One trade per direction per day** — no re-entries after a stop-out.
**Exits:**
- Stop: opposite IB level (IB Low for longs, IB High for shorts)
- Target: 1.5× the IB range beyond the breakout level
- EOD flat: any open position is closed at 3:55 PM ET
**Chart visuals:**
- Yellow background = IB building window
- Blue lines = IB High / IB Low / Midpoint
- Green lines = long extension targets (T1 / T2)
- Red lines = short extension targets (T1 / T2)
- Orange line = VWAP
- Gray background = day filtered out by range rules
**Settings:** All parameters are adjustable — IB window, trade window, target multiples, stop mode, range filter thresholds, and VWAP filter toggle.
Built and backtested on MES1! 5-minute chart. Commission set to $2.25/contract, 1-tick slippage included.
--- 策略

OTE Sweep Signal + MTF Bias + VWAP + DR# OTE Sweep Signal + MTF Bias + VWAP + DR
## Overview
A comprehensive intraday trading system that combines four core concepts into one indicator: **Dealing Range (DR) session boxes**, **Optimal Trade Entry (OTE) sweep signals**, **Multi-Timeframe (MTF) bias**, and **VWAP**. Designed for futures traders (NQ, MNQ, ES, MES) but works on any liquid intraday instrument.
The indicator automatically identifies when price sweeps liquidity above or below a prior HTF candle's high or low, pulls back into the 50–61.8% retracement zone (the OTE), and fires an entry signal — all filtered by session time, swing structure, range limits, VWAP, and a confirmed Dealing Range bias.
---
## How It Works
### 1. HTF Sweep Detection
On each new bar of your chosen Signal Timeframe (default 60m), the indicator locks in the prior candle's high and low as liquidity targets. If price sweeps above the prior high without taking the prior low (bull sweep), or below the prior low without taking the prior high (bear sweep), the sweep is locked in and the OTE zone is drawn.
### 2. OTE Zone
Once a sweep is detected, the indicator calculates the retracement zone between the 50% and your chosen OTE level (default 61.8%) of the swept candle's range. When price closes back inside this zone for the first time, an entry signal fires.
### 3. Entry, Stop, BE, and Target
- **Entry**: Top of OTE zone (bull) or bottom (bear)
- **Stop**: Prior candle high/low OR OTE zone buffer (selectable)
- **Break Even (BE)**: HTF candle open price
- **Target**: Prior candle H/L, next HTF swing H/L, or a fixed R:R multiplier
Each signal draws a label showing all four levels.
---
## Settings Groups
### Timeframe
- **Signal Timeframe** — The HTF used to identify sweeps and draw the OTE zone. Default 60m. Works on any intraday TF (5m, 15m, 30m, 60m, 240m).
- **Auto Sweep Window** — Automatically sets the window for valid sweeps to 1/3 of the signal TF duration. Turn off to set manually.
- **Sweep Window (minutes)** — Manual sweep window when Auto is off.
---
### OTE Zone
- **OTE Level (%)** — The deep retracement level that defines the bottom of the OTE zone. Default 61.8%. Range: 55–79%.
- **Show OTE Zone** — Toggle the shaded OTE box on/off.
- **Show Key Levels** — Toggle individual level lines (prior H/L, open, stop, target).
---
### Signals
- **Show Entry Arrows** — LONG/SHORT arrows plotted at the signal bar.
- **Show Stop & Target Label** — Detailed label with Entry, Stop, BE, and Target levels.
- **Stop Method** — *Prior Candle High/Low*: stop at the swept candle's opposite extreme. *OTE Zone Buffer*: stop just beyond the OTE deep level by a % of range.
- **OTE Stop Buffer** — Buffer percentage when using OTE Zone Buffer stop method.
- **Max Prior Candle Range (pts)** — Filters out signals where the swept candle's range is too large to produce a clean OTE setup. Default 100 pts.
- **Enable Max Range Filter** — Toggle the range filter on/off.
- **Target Method** — *Prior Candle H/L*: target the opposite extreme of the swept candle. *Next Swing H/L*: target the nearest HTF swing high/low beyond the sweep. *Fixed R:R*: target = entry ± (risk × multiplier).
- **Fixed R:R Multiplier** — Used only when Target Method is Fixed R:R. 2.0 = 2:1 reward to risk.
---
### Swing Filter
Filters out signals where price has swept through an intermediate HTF swing high or low between the prior candle extreme and the current bar. This prevents chasing signals that are actually breaking through multi-bar structure, not just taking a liquidity sweep.
- **Enable Swing Filter** — Toggle on/off.
- **Show Swing Levels** — Plots the four most recent HTF swing highs and lows as reference lines.
- **Show Blocked Signals** — Shows faded X arrows where a signal was detected but blocked by the swing filter or range filter.
---
### Session Filter
- **Enable Session Filter** — Only fire OTE signals during your defined trading hours.
- **Session Start Hour (ET)** — Default 9 (9 AM ET).
- **Session End Hour (ET)** — Default 16 (4 PM ET).
---
### Dealing Range (DR)
The Dealing Range (also called the Initial Balance) is the high/low established during each session's opening window. Three sessions are tracked independently.
**Session Times (all ET):**
| Session | Build Window | Extend Window |
|---|---|---|
| Asia | 7:00 PM – 8:00 PM | 8:00 PM – 2:00 AM |
| London | 3:00 AM – 4:00 AM | 4:00 AM – 8:30 AM |
| New York | 9:30 AM – 10:30 AM | 10:30 AM – 4:00 PM |
**Display options:**
- **Show Asia / London / New York DR** — Toggle each session independently.
- **DR Time / Extend** — Fully customizable session windows for each.
- **Show DR Box (build window only)** — Shaded box that spans only the DR build period. Updates live as price builds the range and freezes when the session ends.
- **Show DR High/Low Lines** — Horizontal lines at the DR high and low. Can extend into the session extend window.
- **Extend H/L Lines into session** — When on, H/L lines extend to the end of the session extend window.
- **Show DR Open Line** — Dashed line at the first price of the DR session.
- **Show 25 / 50 / 75% Levels** — Internal DR levels at 25%, 50%, and 75% of the DR range. Update live during the build window and freeze when the DR closes. Labeled at the right edge.
- **Extend % Lines into session** — When on, the 25/50/75% lines also extend into the extend window.
- **Show % Level Labels** — Small text labels at the right edge of each % line.
- **Line Width** — Width of all DR lines (1–4 px).
**Per-session colors:** Each session (Asia, London, NY) has three separate color pickers — Box fill, High/Low line, and % lines — so you can distinguish sessions at a glance.
**DR Open Line Color** — Shared color for the open line across all sessions.
**NY DR Break + Day Bias Filter:**
Once the NY DR build window closes (10:30 AM), the indicator watches for price to close outside the NY DR high or low. When confirmed, it locks in the day's directional bias and fires a labeled arrow on the chart.
- **Filter OTE by NY DR Break Direction** — When on, only takes OTE longs when day bias is BULL, only takes OTE shorts when day bias is BEAR.
- **Show DR Break Label on Chart** — Arrow label showing "BULL DR" or "BEAR DR" with timestamp at the confirmation bar.
- **Confirmation Closes Required** — Number of consecutive closes beyond the DR high/low needed to confirm (1–3). Default 1.
- **Enable Time Gate** — Prevents the DR bias filter from activating before a set time. Avoids pre-market fakeouts locking you into one direction all day. Default 10:30 AM ET.
- **Gate Hour / Gate Minute** — The time gate threshold.
- **Block All Signals Before Gate Time** — When on, no OTE signals fire at all until the gate time passes.
- **Break Bull / Bear Color** — Colors for the DR break label and bias display.
---
### VWAP
- **Show VWAP Line** — Plots the session VWAP. Color and width adjustable.
- **Enable VWAP Filter** — When on, only takes long OTE signals when price is above VWAP, and short signals when below. Defaults to OFF — use the Results Table to A/B test its effect.
- **Show VWAP Distance in Bias Table** — Adds a row to the MTF Bias Table showing how many points price is currently above or below VWAP.
---
### HTF Range Box
Draws a shaded box for every bar of your Signal Timeframe, spanning the full high-to-low range. The box updates live as the HTF candle builds and the color reflects the current candle's direction (green if close ≥ open, red if not). These boxes give immediate visual context for where the HTF candle is relative to its own range.
- **Show HTF Range Box** — Toggle on/off.
- **Bull / Bear Fill Color** — Box fill colors for bullish and bearish HTF candles.
- **Bull / Bear Border Color** — Border colors.
- **Border Width** — 0–4 px.
- **Extend Current Box Right** — When on, the active box projects one bar to the right.
---
### MTF Bias Table
A live bias dashboard showing whether each of your seven chosen timeframes is currently Bullish, Bearish, or Neutral — based on whether the current bar has broken above the prior bar's high or below the prior bar's low.
- **Show MTF Bias Table** — Toggle on/off.
- **TF 1–7** — Set any seven timeframes to monitor. Defaults: 1, 5, 15, 30, 60, 240, D.
- **Bias Table Position** — Top Right, Top Left, Bottom Right, Bottom Left.
- **Bias Table Size** — Tiny, Small, Normal, Large.
- **Show Bull/Bear Score Row** — Summary row showing count of bullish vs bearish TFs (e.g. "4B / 3S").
- **Show Accuracy (n / %)** — For each TF, tracks how often the bias signal correctly predicted the following bar's close direction. Shows percentage and sample count. Each TF accumulates at its own rate — a 1m TF will have far more samples than a Daily.
- **All color options** — Separate colors for bullish fill/text, bearish fill/text, neutral fill/text, header fill/text, score row fill/text.
The table also includes a **NY DR BIAS** row at the bottom showing the current day's confirmed Dealing Range direction and whether the filter is active.
---
### Colors
- **Bullish / Bearish Color** — Main signal colors used for OTE zone fills and entry arrows.
- **Zone Transparency %** — How transparent the OTE zone fill is (60–95%).
---
### Results Table (Table 1 — Summary)
A compact performance summary. Position is independently configurable.
- **Show Results Table** — Toggle on/off.
- **Summary Table Position** — Where to anchor Table 1 (settings + stats + P&L).
- **Table Size** — Tiny, Small, Normal, Large.
- **Timezone** — ET by default.
- **$ Per Point** — Set to 20 for NQ, 2 for MNQ, 50 for ES, 5 for MES.
- **Number of Contracts** — Scales all dollar P&L figures.
**Table 1 shows:**
- Active filter settings (stop method, swing filter, session, max range, target, VWAP, DR)
- Trades, Wins, Break Evens, Losses, Blocked signals, Win Rate
- Avg Win (pts + $), Avg Loss (pts + $), Total Won, Total Lost
- Net P&L (pts + $)
---
### Results Table (Table 2 — Hour/Slot Breakdown)
Separate table showing performance broken down by time slot. Works correctly for any signal timeframe — a 30m signal TF shows `9:30AM-10:00AM` style slots, not just hourly.
- **Hour Table Position** — Where to anchor Table 2. Default: Bottom Left (separate from Table 1).
- **Columns**: Time slot | W | BE | L | Net Pts
---
## Signal Logic Summary
A signal fires when ALL of the following are true:
1. Price swept the prior HTF candle's high (long) or low (short) within the sweep window
2. Price closed back inside the OTE zone for the first time
3. Within the session filter hours
4. Prior candle range did not exceed the max range filter
5. No intermediate HTF swing high/low was breached (swing filter)
6. VWAP filter passed (if enabled)
7. NY DR bias filter passed (if enabled and confirmed)
8. Past the time gate (if block-before-gate is enabled)
Signals blocked by filters 4–8 are shown as faded X arrows so you can visually audit what the filters are doing.
---
## Notes
- Works best on 1m and 5m charts with the Signal Timeframe set to 30m, 60m, or 240m.
- The indicator uses `max_bars_back=5000` to support longer lookback periods.
- DR boxes and lines use `xloc.bar_time` for precise timestamp-based placement.
- On chart timeframes below 5 minutes, a 5m security request is used for DR calculations to match the original DR/Initial Balance convention.
- All dollar P&L figures are estimates based on your $ Per Point and contract count settings — not a substitute for actual brokerage records. 指標

Initial Balance Break Planner [AGPro Series]Initial Balance Break Planner
🧠 Core Idea
Is the Initial Balance break being accepted, or is it becoming vulnerable to failure back inside the balance?
📌 Overview / What it does
Initial Balance Break Planner is an intraday session planning tool built around the first major balance of the trading session. It maps a configurable Initial Balance window, tracks the first break beyond that balance, and evaluates whether that break has enough quality to deserve structured review. The default showcase workflow is designed for intraday charts up to 60 minutes.
The script produces a locked Initial Balance box, break review labels, acceptance labels, failure-risk labels, failed-IB markers, target rails, and an invalidation reference. The panel summarizes the active state through IB State, Break Side, Acceptance Score, Failure Risk, and Action.
It does not predict future price movement, automate trades, or tell the user what to buy or sell. It is a rule-based decision-support overlay for reading Initial Balance behavior with more structure.
🎯 Purpose & Design Philosophy
This script was built to solve a common intraday problem: many traders can see that price broke the first balance, but they still need a cleaner way to judge whether that break is accepted, stretched, weak, or vulnerable.
The tool is designed for traders who use session structure, Initial Balance concepts, intraday breakouts, and structured risk review. Its purpose is not to create another simple breakout signal. Its purpose is to turn the Initial Balance break into a practical planning framework.
The design philosophy is simple: map the balance, evaluate the break, show the risk, project the planning rails, and keep the next action readable.
⚡ Why This Script Is Different
Most opening-range tools focus on basic breakout direction, raw high/low levels, or target projections.
This script does NOT clone ORB Quality or Opening Range Failure Zones. ORB Quality is focused on opening range breakout quality and drive continuation. Opening Range Failure Zones is focused on failed opening range probes and reclaim zones.
Instead, Initial Balance Break Planner focuses on the post-IB decision layer: is the first Initial Balance break accepted, does the retest response support the break, where is the invalidation reference, where are the target rails, and what should the trader review next?
⚙️ Methodology
1. Context Detection
The script builds the Initial Balance from a configurable session window. The default uses the first 60 minutes of the New York regular session.
2. Reference Mapping
Once the IB window ends, the script locks the IB high, IB low, and midpoint. The box remains centered with an internal state label so the chart stays visually clear.
3. Reaction Evaluation
After the first break, the planner scores the setup using:
• IB width
• Break close quality
• Retest response
• Relative volume support
• Volatility fit
4. Visual Output
The chart displays break labels, acceptance labels, risk-review labels, failed-IB markers, target rails, and an invalidation rail. The panel converts the model into a compact next-action state.
🗺️ How to Read the Chart
The Initial Balance box represents the first session balance selected by the user.
Break labels show when price closes beyond the IB edge with enough buffer to start review.
Acceptance labels appear when the break has enough score, enough confirmation time, and controlled failure risk.
Failure-risk labels warn that the break is weakening or returning back inside the balance.
Target rails show measured planning references from the broken IB edge.
The invalidation rail marks the area where the break begins losing acceptance quality.
Panel colors summarize the current state:
• Teal → stronger acceptance or constructive long-side context
• Pink → bearish break side or failed context
• Amber → watch, risk review, or unresolved state
• Indigo / blue → active planning context
🚦 Signals & States
• IB READY → the Initial Balance has locked and the planner is ready to track the first break
• BREAK UP REVIEW → price closed beyond the upper IB edge and long-side review has started
• BREAK DOWN REVIEW → price closed beyond the lower IB edge and short-side review has started
• RETEST HOLD → price retested the broken IB edge without clearly losing it
• ACCEPTED → the break met the acceptance threshold with controlled failure risk
• RISK REVIEW → the break is not yet accepted and failure vulnerability is rising
• FAILED IB → price failed back inside the Initial Balance with elevated weakness context
🔔 Alerts Logic
Alerts trigger when the script detects:
• A bullish IB break review
• A bearish IB break review
• Bullish IB acceptance
• Bearish IB acceptance
• Failure-risk review
• Failed return back inside the IB
Alerts are attention markers only. They are not trade instructions.
🧩 Confluence Logic
The strongest context appears when the break close is clean, the IB width is balanced, volume is supportive, volatility is not overheated, and the retest response holds the broken edge.
When these elements align, the Acceptance Score improves and the panel can move from Observe Retest into Review Long or Review Short.
📊 When to Use
• Intraday markets with clear session structure
• 1-minute to 60-minute charts
• Index, futures, FX, and liquid crypto sessions
• Initial Balance breakout review
• Session expansion planning
• Post-break retest evaluation
• Risk and target planning after the first session balance breaks
⚠️ When NOT to Use
• Very low-liquidity symbols
• Extremely noisy micro timeframes
• Markets with poor session definition
• Events with abnormal volatility spikes
• Symbols where volume data is unreliable and should not be weighted heavily
• Higher timeframes where the selected IB session has little practical meaning
• 4H, daily, weekly, or monthly charts where a one-session Initial Balance cannot be mapped cleanly
🎛️ Key Inputs
• Initial Balance Window → defines the balance-building period
• Tracking Session → defines when break review can update
• Sensitivity → adjusts how selective the planner is
• Acceptance Lookback → controls the review window after the first break
• Minimum Acceptance Score → sets the threshold for accepted-break states
• Confirmation Mode → chooses confirmed-bar behavior or live updating
• Break Buffer ATR → controls how far price must close beyond the IB edge
• Retest Response Buffer ATR → controls retest tolerance around the broken edge
• Failure Buffer ATR → controls how quickly returning inside the IB raises risk
• Target Rail Multiples → control measured target references
• Max Visible IB Boxes → controls how many recent balance boxes stay on the chart
• Max Visible Labels → controls how many recent event labels stay on the chart
• Show IB Ready Labels → optionally displays a readiness label when the Initial Balance locks
• Visual Settings → control labels, box count, rail projection, and spacing
• Panel Settings → control panel visibility, location, theme, and font size
🖥️ Interface & Visual Design
The script uses a chart-first design. The Initial Balance box is the main anchor, and the centered box label keeps the active state visible without requiring a large dashboard.
Event labels are deliberately compact and offset away from candles. Target rails and invalidation rails are projected only after a break, so the chart remains clean during the balance-building phase.
The AG Pro panel uses a single merged blue header row and five compact rows so the user can quickly scan state, side, score, risk, and action.
🧪 Practical Usage Workflow
1. Read the panel after the Initial Balance locks.
2. Wait for price to break one IB edge.
3. Check whether the break receives a clean score or moves into risk review.
4. Watch the broken edge for retest behavior.
5. Use the target rails and invalidation rail as planning references.
6. Interpret the result within broader market context.
🔍 Interpretation Guidelines
The Acceptance Score is a quality score, not a prediction. Higher scores mean the break has better internal structure according to the script's rules.
Failure Risk is a warning layer. It rises when price loses acceptance quality, moves back inside the IB, shows weak close behavior, or lacks participation.
The Action row is the most practical summary. It helps the user decide whether the environment is still building, waiting, reviewing, accepted, vulnerable, or better left alone.
🚫 What This Script Is NOT
• Not a prediction engine
• Not financial advice
• Not auto trading
• Not guaranteed signals
• Not a generic ORB breakout system
• Not Opening Range Failure Zones
• Not a broad support/resistance or order-block map
⚠️ Limitations & Transparency
Initial Balance behavior changes across symbols, sessions, and timeframes. A 60-minute IB on one market may behave differently from the same window on another market.
Relative volume can be less useful on symbols where reported volume is incomplete or inconsistent.
Fast news events, thin liquidity, and unusual volatility can reduce the usefulness of any session-break model.
The script evaluates rule-based context only. It cannot know future order flow or guarantee what price will do next.
🧠 Market Context Notes
Initial Balance analysis is most useful when the session has a meaningful opening phase and a clear expansion phase.
A clean break usually needs more than a line cross. The break should show location, acceptance, participation, and controlled risk.
A weak break can still travel further, and a strong break can still fail. The script is designed to help structure the review, not remove uncertainty.
🧾 Use Case Examples
When price breaks above the IB high, receives a strong acceptance score, holds the broken edge on retest, and keeps failure risk low, the panel may move into Review Long.
When price breaks below the IB low but quickly returns back inside the balance with weak close quality, the panel may move into Failure Watch or Failed Back In.
When the IB is too wide, volatility is unstable, and the break lacks volume support, the planner can remain cautious even if price has crossed the edge.
🧱 System Philosophy
The AGPro Series approach is built around decision structure, not raw signal output.
Initial Balance Break Planner follows that philosophy by combining a visible session reference with a score, risk layer, target references, and a next-action panel.
The goal is to make the chart easier to interpret without making the chart crowded.
🔐 Non-Promise Statement
This script does not provide certainty.
It does not guarantee that an accepted break will continue or that a vulnerable break will reverse.
All outputs should be interpreted as structured analytical context.
📉 Risk Disclosure
Trading involves risk.
Users are responsible for their own analysis, execution, and risk management.
This script is not financial advice and does not provide guaranteed trading outcomes.
📚 Educational Note
Initial Balance analysis can help traders study how a session moves from balance into expansion, but it should always be combined with broader market structure, liquidity, volatility, and personal execution rules.
指標

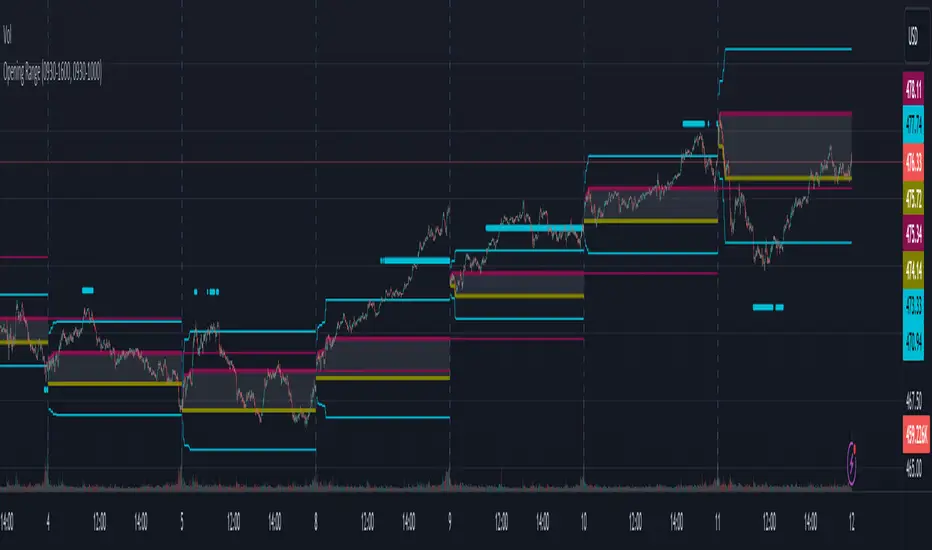
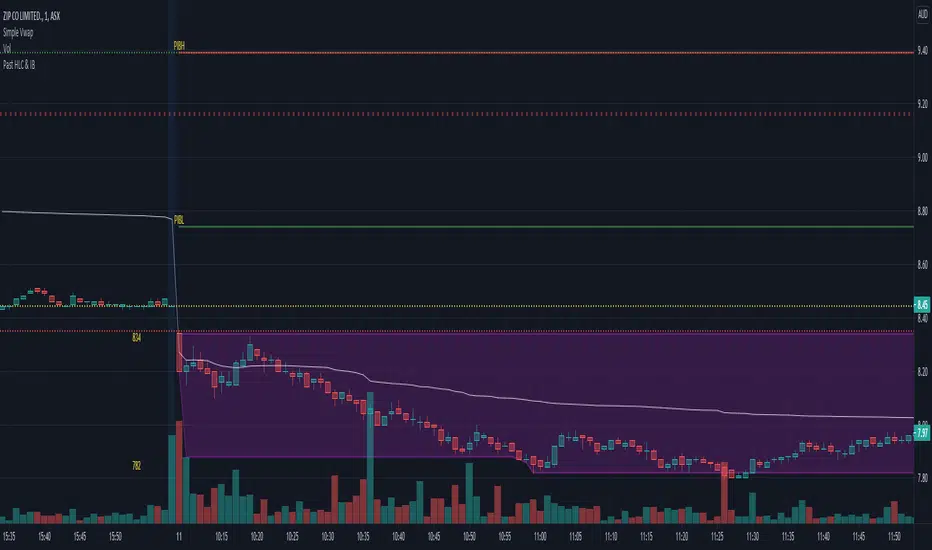
Prior Levels [crlmx] Previous Levels (prLevels) is a Multi-timeframe horizontal price level tool, presenting current/previous day, previous week and custom sessions with optional Initial Balance.
Key Features
- Offering: Open, High, Low, Mid levels on all timeframes
- On/off visibility toggle for sections and individual levels
- Optional price display labels
- Session presets: NYC, London, Asia
- Custom Session timeframes: 4H, 8H, 12H, Month
- Initial Balance: first-hour box with extending H/L reference lines
- Weekday-only session detection for accurate weekend display
- Streamlined input / UI brought to you by crlmx
Trading Applications
- Automated key previous levels for support and resistance read
- Disable unused sections to keep charts clean and reduce visual noise
- Track session-specific ranges for multi-session markets
- Use Initial Balance as directional reference for the day
- Combine with volume or momentum indicators to confirm level reactions
- Intraday Levels: Current Day + Previous Day | Chart: 1-15 min
- Swing Reference: Previous Day + Previous Week | Chart: 15 min - 1H
- Session Trading: Custom Session (NYC/LDN/Asia) + IB | Chart: 1-5 min
- Multi-Session: Stack multiple instances with different session presets
- Initial Balance: Works on 1-5 min charts and can resolve into S/Rs
- Previous Week: Levels for context on session breaks and failed auctions
Version History
- v0.47: Initial release
指標

指標

Initial Balance Breakout Signals [LuxAlgo]The Initial Balance Breakout Signals help traders identify breakouts of the Initial Balance (IB) range.
The indicator includes automatic detection of IB or can use custom sessions, highlights top and bottom IB extensions, custom Fibonacci levels, and goes further with an IB forecast with two different modes.
🔶 USAGE
The initial balance is the price range made within the first hour of the trading session. It is an intraday concept based on the idea that high volume and volatility enter the market through institutional trading at the start of the session, setting the tone for the rest of the day.
The initial balance is useful for gauging market sentiment, or, in other words, the relationship between buyers and sellers.
Bullish sentiment: Price trades above the IB range.
Mixed sentiment: Price trades within the IB range.
Bearish sentiment: Price trades below the IB range.
The initial balance high and low are important levels that many traders use to gauge sentiment. There are two main ideas behind trading around the IB range.
IB Extreme Breakout: When the price breaks and holds the IB high or low, there is a high probability that the price will continue in that direction.
IB Extreme Rejection: When the price tries to break those levels but fails, there is a high probability that it will reach the opposite IB extreme.
This indicator is a complete Initial Balance toolset with custom sessions, breakout signals, IB extensions, Fibonacci retracements, and an IB forecast. All of these features will be explained in the following sections.
🔹 Custom Sessions and Signals
By default, sessions for Initial Balance and breakout signals are in Auto mode. This means that Initial Balance takes the first hour of the trading session and shows breakout signals for the rest of the session.
With this option, traders can use the tool for open range trading, making it highly versatile. The concept behind open range (OR) is the same as that of initial balance (IB), but in OR, the range is determined by the first minute, three or five minutes, or up to the first 30 minutes of the trading session.
As shown in the image above, the top chart uses the Auto feature for the IB and Breakouts sessions. The bottom chart has the Auto feature disabled to use custom sessions for both parameters. In this case, the first three minutes of the trading session are used, turning the tool into an Open Range trading indicator.
This chart shows another example of using custom sessions to display overnight NASDAQ futures sessions.
The left chart shows a custom session from the Tokyo open to the London open, and the right chart shows a custom session from the London open to the New York open.
The chart shows both the Asian and European sessions, their top and bottom extremes, and the breakout signals from those extremes.
🔹 Initial Balance Extensions
Traders can easily extend both extremes of the Initial Balance to display their preferred targets for breakouts. Enable or disable any of them and set the IB percentage to use for the extension.
As the chart shows, the percentage selected on the settings panel directly affects the displayed levels.
Setting 25 means the tool will use a quarter of the detected initial balance range for extensions beyond the IB extremes. Setting 100 means the full IB range will be used.
Traders can use these extensions as targets for breakout signals.
🔹 Fibonacci Levels
Traders can display default or custom Fibonacci levels on the IB range to trade retracements and assess the strength of market movements. Each level can be enabled or disabled and customized by level, color, and line style.
As we can see on the chart, after the IB was completed, prices were unable to fall below the 0.236 Fibonacci level. This indicates significant bullish pressure, so it is expected that prices will rise.
Traders can use these levels as guidelines to assess the strength of the side trying to penetrate the IB. In this case, the sellers were unable to move the market beyond the first level.
🔹 Initial Balance Forecast
The tool features two different forecasting methods for the current IB. By default, it takes the average of the last ten values and applies a multiplier of one.
IB Against Previous Open: averages the difference between IB extremes and the open of the previous session.
Filter by current day of the week: averages the difference between IB extremes and the open of the current session for the same day of the week.
This feature allows traders to see the difference between the current IB and the average of the last IBs. It makes it very easy to interpret: if the current IB is higher than the average, buyers are in control; if it is lower than the average, sellers are in control.
For example, on the left side of the chart, we can see that the last day was very bullish because the IB was completely above the forecasted value. This is the IB mean of the last ten trading days.
On the right, we can see that on Monday, September 15, the IB traded slightly higher but within the forecasted value of the IB mean of the last ten Mondays. In this case, it is within expectations.
🔶 SETTINGS
Display Last X IBs: Select how many IBs to display.
Initial Balance: Choose a custom session or enable the Auto feature.
Breakouts: Enable or disable breakouts. Choose custom session or enable the Auto feature.
🔹 Extensions
Top Extension: Enable or disable the top extension and choose the percentage of IB to use.
Bottom extension: Enable or disable the bottom extension and choose the percentage of IB to use.
🔹 Fibonacci Levels
Display Fibonacci: Enable or disable Fibonacci levels.
Reverse: Reverse Fibonacci levels.
Levels, Colors & Style
Display Labels: Enable or disable labels and choose text size.
🔹 Forecast
Display Forecast: Select the forecast method.
- IB Against Previous Open: Calculates the average difference between the IB high and low and the previous day's IB open price.
- Filter by Current Day of Week: Calculates the average difference between the IB high and low and the IB open price for the same day of the week.
Forecast Memory: The number of data points used to calculate the average.
Forecast Multiplier: This multiplier will be applied to the average. Bigger numbers will result in wider predicted ranges.
Forecast Colors: Choose from a variety of colors.
Forecast Style: Choose a line style.
🔹 Style
Initial Balance Colors
Extension Transparency: Choose the extension's transparency. 0 is solid, and 100 is fully transparent.
指標

RTH Levels: VWAP + PDH/PDL + ONH/ONL + IBAlgo Index — Levels Pro (ONH/ONL • PDH/PDL • VWAP±Bands • IB • Gaps)
Purpose. A session-aware, non-repainting levels tool for intraday decision-making. Designed for futures and indices, with clean visuals, alerts, and a one-click Minimal Mode for screenshot-ready charts.
What it plots
• PDH/PDL (RTH-only) – Prior Regular Trading Hours high/low, computed intraday and frozen at the RTH close (no 24h mix-ups, no repainting).
• ONH/ONL – Prior Overnight high/low, held throughout RTH.
• RTH VWAP with ±σ bands – Volume-weighted variance, reset each RTH.
• Initial Balance (IB) – First N minutes of RTH, plus 1.5× / 2.0× extensions after IB completes.
• Today’s RTH Open & Prior RTH Close – With gap detection and “gap filled” alert.
• Killzone shading – NY Open (09:30–10:30 ET) and Lunch (11:15–13:30 ET).
• Values panel (top-right) – Each level with live distance in points & ticks.
• Right-edge level tags – With anti-overlap (stagger + vertical jitter).
• Price-scale tags – Native trackprice markers that always “stick” to the axis.
⸻
New in v6.4
• Minimal Mode: one click for a clean look (thinner lines, VWAP bands/IB extensions hidden, on-chart right-edge labels off; price-scale tags remain).
• Theme presets: Dark Hi-Contrast / Light Minimal / Futures Classic / Muted Dark.
• Anti-overlap controls: horizontal staggering, vertical jitter, and baseline offset to keep tags readable even when levels cluster.
⸻
Quick start (2 minutes)
1. Add to chart → keep defaults.
2. Sessions (ET):
• RTH Session default: 09:30–16:00 (US equities cash hours).
• Overnight Session default: 18:00–09:29.
Adjust for your market if you use different “day” hours (e.g., many use 08:20–13:30 ET for COMEX Gold).
3. Theme & Minimal Mode: pick a Theme Preset; enable Minimal Mode for screenshots.
4. Visibility: toggle PD/ON/VWAP/IB/References/Panel to taste.
5. Right-edge labels: turn Show Right-Edge Labels on. If they crowd, tune:
• Anti-overlap: min separation (ticks)
• Horizontal offset per tag (bars)
• Vertical jitter per step (ticks)
• Right-edge baseline offset (bars)
6. Alerts: open Add alert → Condition: and pick the events you want.
⸻
How levels are computed (no repainting)
• PDH/PDL: Intraday H/L are accumulated only while in RTH and saved at RTH close for “yesterday’s” values.
• ONH/ONL: Accumulated across the defined Overnight window and then held during RTH.
• RTH VWAP & ±σ: Volume-weighted mean and standard deviation, reset at the RTH open.
• IB: First N minutes of RTH (default 60). Extensions (1.5×/2.0×) appear after IB completes.
• Gaps: Today’s RTH open vs prior RTH close; “Gap Filled” triggers when price trades back to prior close.
⸻
Practical playbooks (how to trade around the levels)
1) PDH/PDL interactions
• Rejection: Price taps PDH/PDL then closes back inside → mean-reversion toward VWAP/IB.
• Acceptance: Close/hold beyond PDH/PDL with momentum → continuation to next HTF/IB target.
• Alert: PD Touch/Break.
2) ONH/ONL “taken”
• Often one ON extreme is taken during RTH. ONH Taken / ONL Taken → check if it’s a clean break or sweep & reclaim.
• Sweep + reclaim near VWAP can fuel rotations through the ON range.
3) VWAP ±σ framework
• Balanced: First tag of ±1σ often reverts toward VWAP.
• Trend: Persistent trade beyond ±1σ + IB break → target ±2σ/±3σ.
• Alerts: VWAP Cross and VWAP Reject (cross then immediate fail back).
4) IB breaks
• After IB completes, a clean IB break commonly targets 1.5× and sometimes 2.0×.
• Quick return inside IB = possible fade back to the opposite IB edge/VWAP.
• Alerts: IB Break Up / Down.
5) Gaps
• Gap-and-go: Opening drive away from prior close + VWAP support → trend until IB completion.
• Gap-fill: Weak open and VWAP overhead/underfoot → trade toward prior close; manage on Gap Filled alert.
Pro tip: Stack confluences (e.g., ONL sweep + VWAP reclaim + IB hold) and respect your execution rules (e.g., require a 5-minute close in direction, or your order-flow confirmation).
⸻
Inputs you’ll actually touch
• Sessions (ET): Session Timezone, RTH Session, Overnight Session.
• Visibility: toggles for PD/ON/VWAP/IB/Ref/Panel.
• VWAP bands: set σ multipliers (±1/±2/±3).
• IB: duration (minutes) and extension multipliers (1.5× / 2.0×).
• Style & Theme: Theme Preset, Main Line Width, Trackprice, Minimal Mode, and anti-overlap controls.
⸻
Alerts included
• PD Touch/Break — High ≥ PDH or Low ≤ PDL
• ONH Taken / ONL Taken — First in-RTH take of ONH/ONL
• VWAP Cross — Close crosses VWAP
• VWAP Reject — Cross then immediate fail back
• IB Break Up / Down — Break of IB High/Low after IB completes
• Gap Filled — Price trades back to prior RTH close
Setup: Add alert → Condition: Algo Index — Levels Pro → choose event → message → Notify on app/email.
⸻
Panel guide
The top-right panel shows each level plus live distance from last price:
LevelValue (Δpoints | Δticks)
Coloring: green if level is below current price, red if above.
⸻
Styling & screenshot tips
• Use Theme Preset that matches your chart.
• For dark charts, “Dark Hi-Contrast” with Main Line Width = 3 works well.
• Enable Trackprice for crisp axis tags that always stick to the right edge.
• Turn on Minimal Mode for cleaner screenshots (no VWAP bands or IB extensions, on-chart tags off; price-scale tags remain).
• If tags crowd, increase min separation (ticks) to 30–60 and horizontal offset to 3–5; add vertical jitter (4–12 ticks) and/or push tags farther right with baseline offset (bars).
⸻
Behavior & limitations
• Levels are computed incrementally; tables refresh on the last bar for efficiency.
• Right-edge labels are placed at bar_index + offset and do not track extra right-margin scrolling (TradingView limitation). The price-scale tags (from trackprice) do track the axis.
• “RTH” is what you define in inputs. If your market uses different day hours, change the session strings so PDH/PDL reflect your definition of “yesterday’s session.”
⸻
FAQ
Q: My PDH/PDL don’t match the daily chart.
A: By design this uses RTH-only highs/lows, not 24h daily bars. Adjust sessions if you want a different definition.
Q: Right-edge tags overlap or don’t sit at the far right.
A: Increase min separation / horizontal offset / vertical jitter and/or push tags farther with baseline offset. If you want markers that always hug the axis, rely on Trackprice.
Q: Can I change killzones?
A: Yes—edit the session strings in settings or request a version with user inputs for custom windows.
⸻
Disclaimer
Educational use only. This is not financial advice. Always apply your own risk management and confirmation rules.
⸻
Enjoy it? Please ⭐ the script and share screenshots using Minimal Mode + a Theme Preset that fits your style. 指標

指標

指標

指標

指標