INVITE-ONLY SCRIPT
已更新 Ghost Vision I
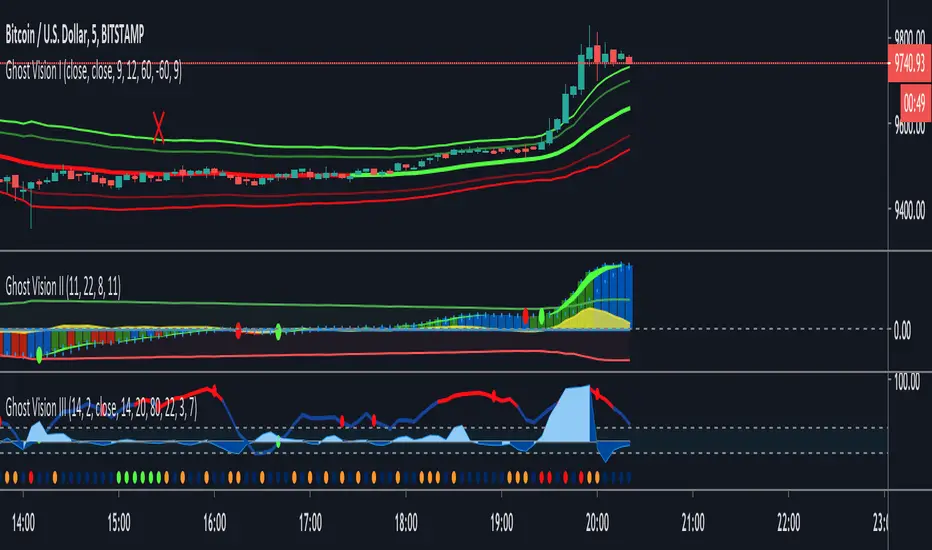
Channels indicate the extreme of the price movement compared to normal movement, a middle line indicates the current trend direction — green for bullish and red for bearish.
Divergences with price are displayed with H — for hidden, and R-for regular likewise green or red for bullish or bearish.
GhostVision I — Will help you to answer the following questions:
Is that price movement has power behind it or it’s just a divergence?
Is the current price is valued fairly or is it extreme?
Is it a good time to enter a position?
Where should I take profit?
Where should put my stop loss?
發行說明
The new addition of danger zone feature & minor improvements.發行說明
Fixing a problem caused by the "max_bars_back" error, now all time frames should work as they should.發行說明
Added my favorite scalping tools on top of GV1 by default so you can have them all at once with one indicator (VWAP, EMA9)- VWAP: Use it for support/resistance and direction of the day
- EMA9: Great for existing a scalp trade before the market turns
- Especially for 5/25min time frame
Blog post on how to use it for day trading coming soon!
(if you're swing trading you can turn it off in the settings)
發行說明
Added alerts for Danger Zone and Divergences, Don't miss important indications anymore.僅限邀請腳本
只有經作者批准的使用者才能訪問此腳本。您需要申請並獲得使用權限。該權限通常在付款後授予。如欲了解更多詳情,請依照以下作者的說明操作,或直接聯絡GhostVision。
除非您完全信任其作者並了解腳本的工作原理,否則TradingView不建議您付費或使用腳本。您也可以在我們的社群腳本中找到免費的開源替代方案。
作者的說明
免責聲明
這些資訊和出版物並不意味著也不構成TradingView提供或認可的金融、投資、交易或其他類型的意見或建議。請在使用條款閱讀更多資訊。
僅限邀請腳本
只有經作者批准的使用者才能訪問此腳本。您需要申請並獲得使用權限。該權限通常在付款後授予。如欲了解更多詳情,請依照以下作者的說明操作,或直接聯絡GhostVision。
除非您完全信任其作者並了解腳本的工作原理,否則TradingView不建議您付費或使用腳本。您也可以在我們的社群腳本中找到免費的開源替代方案。
作者的說明
免責聲明
這些資訊和出版物並不意味著也不構成TradingView提供或認可的金融、投資、交易或其他類型的意見或建議。請在使用條款閱讀更多資訊。