OPEN-SOURCE SCRIPT
Euclidean Range [InvestorUnknown]
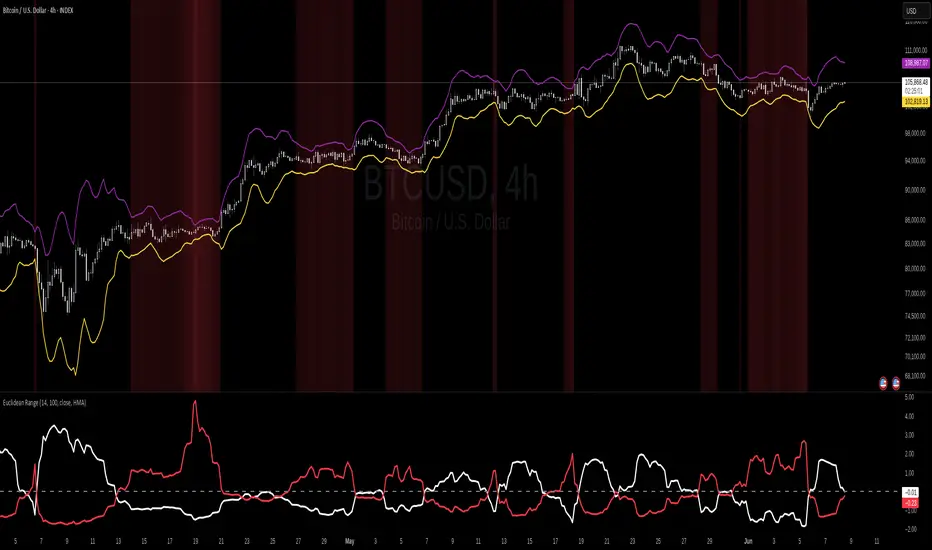
The Euclidean Range indicator visualizes price deviation from a moving average using a geometric concept Euclidean distance. It helps traders identify trend strength, volatility shifts, and potential overextensions in price behavior.
Euclidean Distance
Euclidean distance is a fundamental concept in geometry and machine learning. It measures the "straight-line distance" between two points in space. In time series analysis, it can be used to measure how far one sequence deviates from another over a fixed window.
Pine Script®
In this script, we calculate the Euclidean distance between the price (source) and a smoothed average (reference) over a user-defined window. This gives us a single scalar that reflects the overall divergence between price and trend.
How It Works
Use Cases

Notes
Disclaimer
This indicator is provided for speculative analysis and educational purposes only. It is not financial advice. Always backtest and evaluate in a simulated environment before live trading.
Euclidean Distance
Euclidean distance is a fundamental concept in geometry and machine learning. It measures the "straight-line distance" between two points in space. In time series analysis, it can be used to measure how far one sequence deviates from another over a fixed window.
euclidean_distance(src, ref, len) =>
var float sum_sq_diff = na
sum_sq_diff := 0.0
for i = 0 to len - 1
diff = src - ref
sum_sq_diff += diff * diff
math.sqrt(sum_sq_diff)
In this script, we calculate the Euclidean distance between the price (source) and a smoothed average (reference) over a user-defined window. This gives us a single scalar that reflects the overall divergence between price and trend.
How It Works
- Moving Average Calculation: You can choose between SMA, EMA, or HMA as your reference line. This becomes the "baseline" against which the actual price is compared.
- Distance Band Construction: The Euclidean distance between the price and the reference is calculated over the Window Length. This value is then added to and subtracted from the average to form dynamic upper and lower bands, visually framing the range of deviation.
- Distance Ratios and Z-Scores: Two distance ratios are computed: dist_r = distance / price (sensitivity to volatility); dist_v = price / distance (sensitivity to compression or low-volatility states)
- Both ratios are normalized using a Z-score to standardize their behavior and allow for easier interpretation across different assets and timeframes.
- Z-Score Plots: Z_r (white line) highlights instances of high volatility or strong price deviation; Z_v (red line) highlights low volatility or compressed price ranges.
- Background Highlighting (Optional): When Z_v is dominant and increasing, the background is colored using a gradient. This signals a possible build-up in low volatility, which may precede a breakout.
Use Cases
- Detect volatile expansions and calm compression zones.
- Identify mean reversion setups when price returns to the average.
- Anticipate breakout conditions by observing rising Z_v values.
- Use dynamic distance bands as adaptive support/resistance zones.
Notes
- The indicator is best used with liquid assets and medium-to-long windows.
- Background coloring helps visually filter for squeeze setups.
Disclaimer
This indicator is provided for speculative analysis and educational purposes only. It is not financial advice. Always backtest and evaluate in a simulated environment before live trading.
開源腳本
秉持TradingView一貫精神,這個腳本的創作者將其設為開源,以便交易者檢視並驗證其功能。向作者致敬!您可以免費使用此腳本,但請注意,重新發佈代碼需遵守我們的社群規範。
免責聲明
這些資訊和出版物並非旨在提供,也不構成TradingView提供或認可的任何形式的財務、投資、交易或其他類型的建議或推薦。請閱讀使用條款以了解更多資訊。
開源腳本
秉持TradingView一貫精神,這個腳本的創作者將其設為開源,以便交易者檢視並驗證其功能。向作者致敬!您可以免費使用此腳本,但請注意,重新發佈代碼需遵守我們的社群規範。
免責聲明
這些資訊和出版物並非旨在提供,也不構成TradingView提供或認可的任何形式的財務、投資、交易或其他類型的建議或推薦。請閱讀使用條款以了解更多資訊。