OPEN-SOURCE SCRIPT
% Stocks Above MA
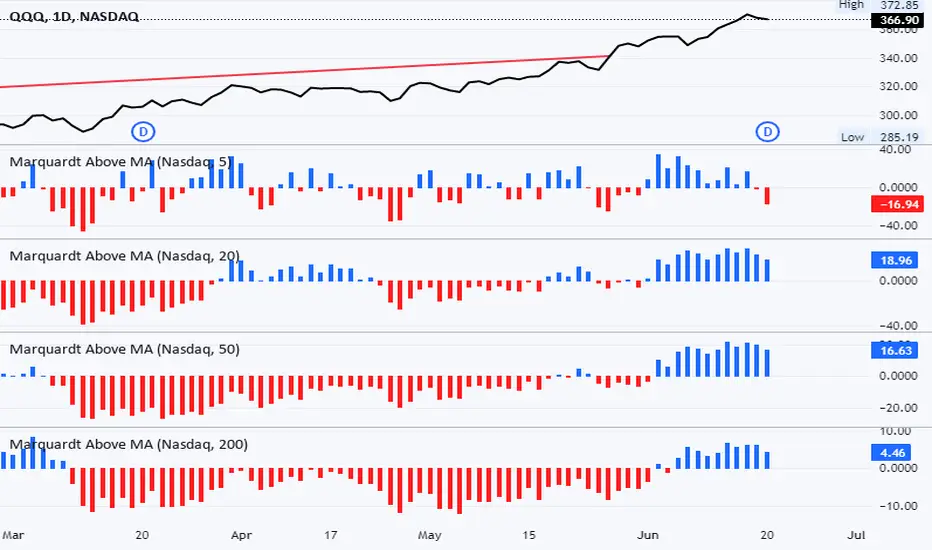
Breadth indicator showing % stocks above various moving averages. Histogram is positive (blue) when % stocks above selected MA is greater than 50%. Histogram is negative (red) when % of stocks above selected MA is less than 50%. Data manipulation causes the actual % value in y-axis to be incorrect but enhances visualization. Actual %'s are simply the displayed values + 50.
Improvements / suggestions welcome.
Improvements / suggestions welcome.
開源腳本
In true TradingView spirit, the creator of this script has made it open-source, so that traders can review and verify its functionality. Kudos to the author! While you can use it for free, remember that republishing the code is subject to our House Rules.
免責聲明
The information and publications are not meant to be, and do not constitute, financial, investment, trading, or other types of advice or recommendations supplied or endorsed by TradingView. Read more in the Terms of Use.