OPEN-SOURCE SCRIPT
Optimized Comprehensive Analysis Table
# Enhanced Comprehensive Analysis Table
This advanced indicator provides a holistic view of market sentiment by analyzing multiple technical indicators simultaneously. It's designed to give traders a quick, at-a-glance summary of market conditions across various timeframes and analysis methods.
## Key Features:
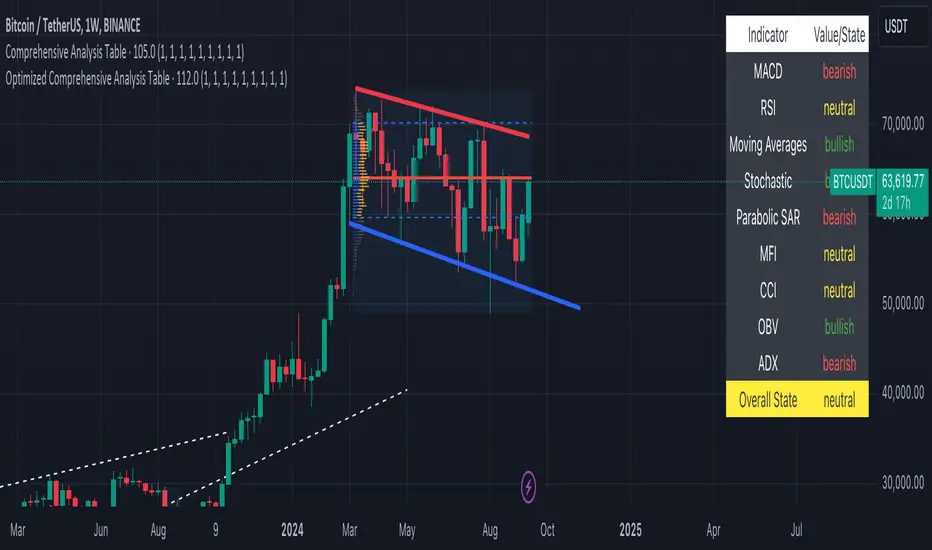
- Analyzes 9 popular technical indicators
- Weighted voting system for overall market sentiment
- Customizable indicator weights
- Clear, color-coded table display
## Indicators Analyzed:
1. MACD (Moving Average Convergence Divergence)
2. RSI (Relative Strength Index)
3. Moving Averages (50, 100, 200-period)
4. Stochastic Oscillator
5. Parabolic SAR
6. MFI (Money Flow Index)
7. CCI (Commodity Channel Index)
8. OBV (On Balance Volume)
9. ADX (Average Directional Index)
## How It Works:
Each indicator's signal is calculated and classified as bullish, bearish, or neutral. These signals are then weighted according to user-defined inputs. The weighted votes are summed to determine an overall market sentiment.
## Interpretation:
- The table displays the state of each indicator and the overall market sentiment.
- Green indicates bullish conditions, red bearish, and yellow neutral.
- The "Overall State" row at the bottom provides a quick summary of the combined analysis.
## Customization:
Users can adjust the weight of each indicator to fine-tune the analysis according to their trading strategy or market conditions.
This indicator is ideal for traders who want a comprehensive overview of market conditions without having to monitor multiple indicators separately. It's particularly useful for confirming trade setups, identifying potential trend reversals, and managing risk.
Note: This indicator is meant to be used as part of a broader trading strategy. Always combine with other forms of analysis and proper risk management.
This advanced indicator provides a holistic view of market sentiment by analyzing multiple technical indicators simultaneously. It's designed to give traders a quick, at-a-glance summary of market conditions across various timeframes and analysis methods.
## Key Features:
- Analyzes 9 popular technical indicators
- Weighted voting system for overall market sentiment
- Customizable indicator weights
- Clear, color-coded table display
## Indicators Analyzed:
1. MACD (Moving Average Convergence Divergence)
2. RSI (Relative Strength Index)
3. Moving Averages (50, 100, 200-period)
4. Stochastic Oscillator
5. Parabolic SAR
6. MFI (Money Flow Index)
7. CCI (Commodity Channel Index)
8. OBV (On Balance Volume)
9. ADX (Average Directional Index)
## How It Works:
Each indicator's signal is calculated and classified as bullish, bearish, or neutral. These signals are then weighted according to user-defined inputs. The weighted votes are summed to determine an overall market sentiment.
## Interpretation:
- The table displays the state of each indicator and the overall market sentiment.
- Green indicates bullish conditions, red bearish, and yellow neutral.
- The "Overall State" row at the bottom provides a quick summary of the combined analysis.
## Customization:
Users can adjust the weight of each indicator to fine-tune the analysis according to their trading strategy or market conditions.
This indicator is ideal for traders who want a comprehensive overview of market conditions without having to monitor multiple indicators separately. It's particularly useful for confirming trade setups, identifying potential trend reversals, and managing risk.
Note: This indicator is meant to be used as part of a broader trading strategy. Always combine with other forms of analysis and proper risk management.
開源腳本
秉持TradingView一貫精神,這個腳本的創作者將其設為開源,以便交易者檢視並驗證其功能。向作者致敬!您可以免費使用此腳本,但請注意,重新發佈代碼需遵守我們的社群規範。
免責聲明
這些資訊和出版物並非旨在提供,也不構成TradingView提供或認可的任何形式的財務、投資、交易或其他類型的建議或推薦。請閱讀使用條款以了解更多資訊。
開源腳本
秉持TradingView一貫精神,這個腳本的創作者將其設為開源,以便交易者檢視並驗證其功能。向作者致敬!您可以免費使用此腳本,但請注意,重新發佈代碼需遵守我們的社群規範。
免責聲明
這些資訊和出版物並非旨在提供,也不構成TradingView提供或認可的任何形式的財務、投資、交易或其他類型的建議或推薦。請閱讀使用條款以了解更多資訊。