OPEN-SOURCE SCRIPT
Gustavo Zone Indicator JULY
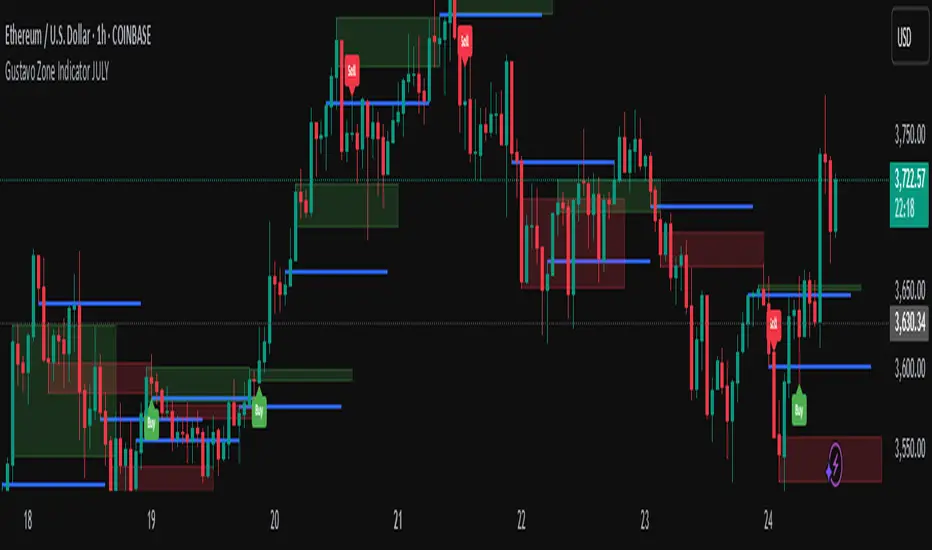
This indicator watches for runs of at least three consecutive green (or red) candles followed by an opposite-color candle, then marks that reversal zone by drawing a rectangle from the wicks of the first two run candles. It optionally plots a horizontal “target” line at the wick of the third run candle. While the zone is active, if three bars in a row close beyond both the zone boundary and the target line, it issues a customizable “Sell” label above the bar (after bullish runs) or a “Buy” label below the bar (after bearish runs). All colors, text labels, sizes, offsets, and toggles for the zones, lines, and signals can be adjusted in the input settings.
開源腳本
秉持TradingView一貫精神,這個腳本的創作者將其設為開源,以便交易者檢視並驗證其功能。向作者致敬!您可以免費使用此腳本,但請注意,重新發佈代碼需遵守我們的社群規範。
免責聲明
這些資訊和出版物並非旨在提供,也不構成TradingView提供或認可的任何形式的財務、投資、交易或其他類型的建議或推薦。請閱讀使用條款以了解更多資訊。
開源腳本
秉持TradingView一貫精神,這個腳本的創作者將其設為開源,以便交易者檢視並驗證其功能。向作者致敬!您可以免費使用此腳本,但請注意,重新發佈代碼需遵守我們的社群規範。
免責聲明
這些資訊和出版物並非旨在提供,也不構成TradingView提供或認可的任何形式的財務、投資、交易或其他類型的建議或推薦。請閱讀使用條款以了解更多資訊。