OPEN-SOURCE SCRIPT
MGC1! - Stats jour du Weekly High/Low Lun Ven
Indicator Name: Weekly High/Low Day Statistics (Probability Dashboard)
Description:
This indicator provides a statistical edge by analyzing historical price action to determine which day of the week is most likely to form the Weekly High or the Weekly Low.
Designed for intraday traders and swing traders, this tool helps you anticipate the structure of the weekly candle. By understanding the probabilities of when the extremums (HOD/LOD of the week) usually occur, you can better align your trade setups with the true weekly expansion.
Key Features:
Historical Analysis: Calculates statistics based on a user-defined lookback period (default is 104 weeks / 2 years) to ensure statistical significance.
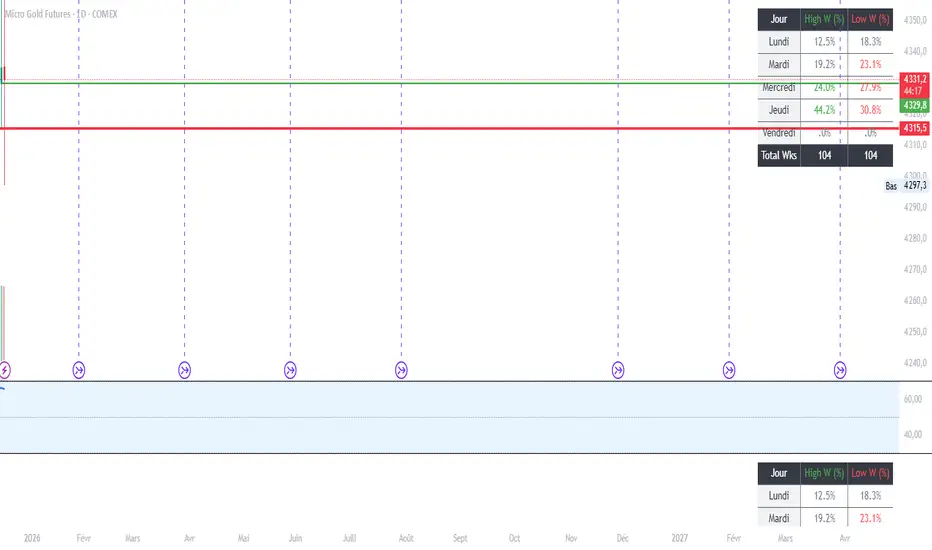
Probability Dashboard: Displays a clean table on the chart showing the percentage chance for each day (Monday to Friday) to be the High or Low of the week.
Rolling Window: Automatically updates data at the close of every week to keep probabilities current.
How to Use (ICT/SMC Context):
Weekly Profiles: Use this data to validate "Classic Tuesday Low" or "Wednesday/Thursday Reversal" profiles.
Bias Confirmation: If the statistics show a 40% chance of the Weekly Low forming on a Tuesday, and price is diving into a Higher Timeframe POI on Tuesday morning, this adds high-probability confluence to your long setups.
Targeting: If the Weekly High typically forms on Thursday and it is currently Wednesday, you can hold runners for an expansion into the next day.
Description:
This indicator provides a statistical edge by analyzing historical price action to determine which day of the week is most likely to form the Weekly High or the Weekly Low.
Designed for intraday traders and swing traders, this tool helps you anticipate the structure of the weekly candle. By understanding the probabilities of when the extremums (HOD/LOD of the week) usually occur, you can better align your trade setups with the true weekly expansion.
Key Features:
Historical Analysis: Calculates statistics based on a user-defined lookback period (default is 104 weeks / 2 years) to ensure statistical significance.
Probability Dashboard: Displays a clean table on the chart showing the percentage chance for each day (Monday to Friday) to be the High or Low of the week.
Rolling Window: Automatically updates data at the close of every week to keep probabilities current.
How to Use (ICT/SMC Context):
Weekly Profiles: Use this data to validate "Classic Tuesday Low" or "Wednesday/Thursday Reversal" profiles.
Bias Confirmation: If the statistics show a 40% chance of the Weekly Low forming on a Tuesday, and price is diving into a Higher Timeframe POI on Tuesday morning, this adds high-probability confluence to your long setups.
Targeting: If the Weekly High typically forms on Thursday and it is currently Wednesday, you can hold runners for an expansion into the next day.
開源腳本
秉持TradingView一貫精神,這個腳本的創作者將其設為開源,以便交易者檢視並驗證其功能。向作者致敬!您可以免費使用此腳本,但請注意,重新發佈代碼需遵守我們的社群規範。
免責聲明
這些資訊和出版物並非旨在提供,也不構成TradingView提供或認可的任何形式的財務、投資、交易或其他類型的建議或推薦。請閱讀使用條款以了解更多資訊。
開源腳本
秉持TradingView一貫精神,這個腳本的創作者將其設為開源,以便交易者檢視並驗證其功能。向作者致敬!您可以免費使用此腳本,但請注意,重新發佈代碼需遵守我們的社群規範。
免責聲明
這些資訊和出版物並非旨在提供,也不構成TradingView提供或認可的任何形式的財務、投資、交易或其他類型的建議或推薦。請閱讀使用條款以了解更多資訊。