OPEN-SOURCE SCRIPT
EMA_cumulativeVolume_crossover[Strategy V2]
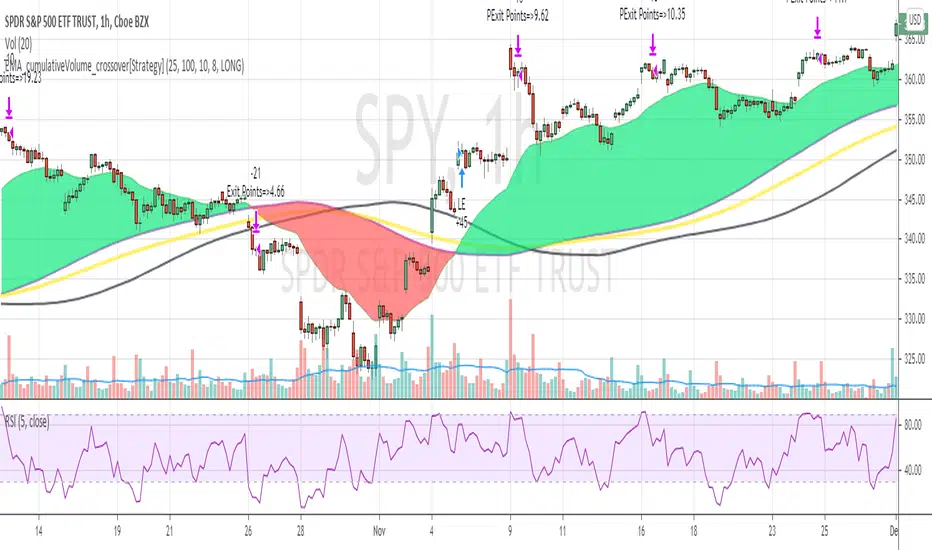
This is variation of EMA_cumulativeVolume_crossover strategy.
instead of cumulative volume crossover, I have added the EMA to cumulative volume of same EMA length.
when EMA crossover EMACumulativeVolume , BUY
when already in LONG position and price crossing over EMACumulativeVolume*2 (orange line in the chart) , Add more
Partial Exit , when RSI 5 crossdown 90
Close All when EMA cross down EMACumulativeVolume
Note
Black Line on the chart is the historical value of EMACumulativeVolume . when EMA area is green and price touch this line closes above it , you can consider consider BUY
I have tested it on SPY , QQQ and UDOW on hourly chart.
EMA setting 25 is working for all of these.
but SPY produces better results on EMA 35 setting
warning
This strategy is published educational purposes only.
開源腳本
秉持TradingView一貫精神,這個腳本的創作者將其設為開源,以便交易者檢視並驗證其功能。向作者致敬!您可以免費使用此腳本,但請注意,重新發佈代碼需遵守我們的社群規範。
免責聲明
這些資訊和出版物並非旨在提供,也不構成TradingView提供或認可的任何形式的財務、投資、交易或其他類型的建議或推薦。請閱讀使用條款以了解更多資訊。
免責聲明
這些資訊和出版物並非旨在提供,也不構成TradingView提供或認可的任何形式的財務、投資、交易或其他類型的建議或推薦。請閱讀使用條款以了解更多資訊。