OPEN-SOURCE SCRIPT
MestreDoFOMO Renko Underground v4.0
Description:
The "MestreDoFOMO Renko Underground v4.0" is a custom indicator for TradingView that creates a dynamic Renko chart to help identify trends and reversal points in the market. Unlike traditional candlestick charts, Renko focuses solely on significant price movements, ignoring time and market noise. This script includes advanced features like support and resistance channels, moving averages, and alerts to assist with your trading decisions.
How It Works:
Dynamic Renko Bricks:
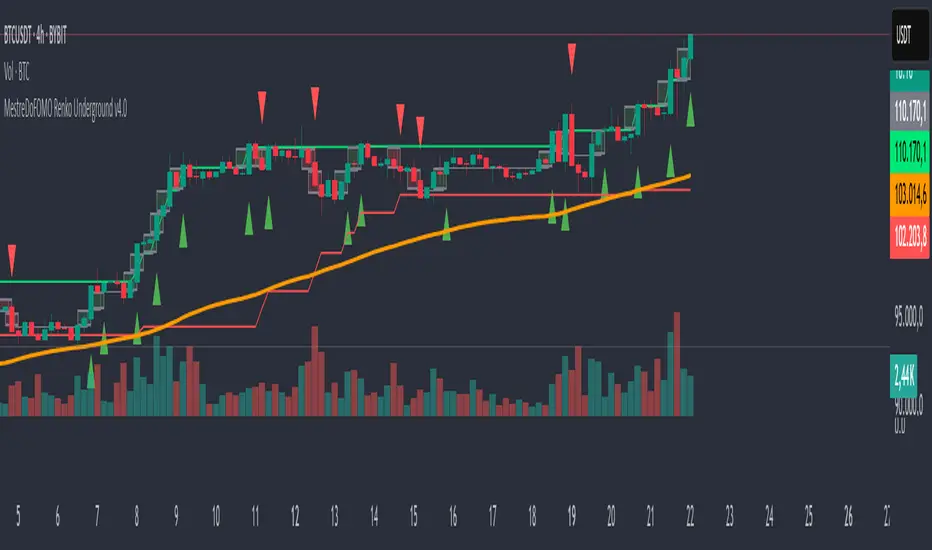
The brick size (price units to form each "box" on the chart) is calculated automatically using the ATR (Average True Range) with an adjustable multiplier. This means the size adapts to the asset's volatility (e.g., BTC/USDT). When the price moves up or down by the brick size, a new brick is created (green for up, red for down).
Reversal Signals:
Green triangles (🔼) appear below bars when the trend shifts to bullish, and red triangles (🔽) appear above when it shifts to bearish. These signals only appear on direction changes, reducing false signals.
Renko Channel:
The script draws two lines (green for resistance and red for support) based on the highs and lows of the last 10 bricks (or the value you set). This helps identify key price zones.
Moving Average on Bricks:
An orange line shows the moving average (EMA or SMA, your choice) of the last 20 bricks, helping confirm the overall trend.
Alerts:
You can set up alerts in TradingView to be notified when the trend shifts to bullish or bearish, perfect for active trading.
Visualization:
A gray dashed line shows the level of the last brick, providing a clear reference for the next expected move.
How to Use:
Add the indicator to your chart (e.g., BTC/USDT 1D).
Adjust parameters like the ATR multiplier, channel length, and moving average type in the settings menu.
Watch the bricks and signals to identify trends, and use the channels and moving average to plan entries and exits.
Enable alerts to receive real-time notifications.
Tip:
Test on different timeframes (1H, 4H, 1D) and adjust the ATR multiplier to match the volatility of the asset you're trading. Combine with other indicators (like RSI) for better results!
The "MestreDoFOMO Renko Underground v4.0" is a custom indicator for TradingView that creates a dynamic Renko chart to help identify trends and reversal points in the market. Unlike traditional candlestick charts, Renko focuses solely on significant price movements, ignoring time and market noise. This script includes advanced features like support and resistance channels, moving averages, and alerts to assist with your trading decisions.
How It Works:
Dynamic Renko Bricks:
The brick size (price units to form each "box" on the chart) is calculated automatically using the ATR (Average True Range) with an adjustable multiplier. This means the size adapts to the asset's volatility (e.g., BTC/USDT). When the price moves up or down by the brick size, a new brick is created (green for up, red for down).
Reversal Signals:
Green triangles (🔼) appear below bars when the trend shifts to bullish, and red triangles (🔽) appear above when it shifts to bearish. These signals only appear on direction changes, reducing false signals.
Renko Channel:
The script draws two lines (green for resistance and red for support) based on the highs and lows of the last 10 bricks (or the value you set). This helps identify key price zones.
Moving Average on Bricks:
An orange line shows the moving average (EMA or SMA, your choice) of the last 20 bricks, helping confirm the overall trend.
Alerts:
You can set up alerts in TradingView to be notified when the trend shifts to bullish or bearish, perfect for active trading.
Visualization:
A gray dashed line shows the level of the last brick, providing a clear reference for the next expected move.
How to Use:
Add the indicator to your chart (e.g., BTC/USDT 1D).
Adjust parameters like the ATR multiplier, channel length, and moving average type in the settings menu.
Watch the bricks and signals to identify trends, and use the channels and moving average to plan entries and exits.
Enable alerts to receive real-time notifications.
Tip:
Test on different timeframes (1H, 4H, 1D) and adjust the ATR multiplier to match the volatility of the asset you're trading. Combine with other indicators (like RSI) for better results!
開源腳本
秉持TradingView一貫精神,這個腳本的創作者將其設為開源,以便交易者檢視並驗證其功能。向作者致敬!您可以免費使用此腳本,但請注意,重新發佈代碼需遵守我們的社群規範。
免責聲明
這些資訊和出版物並非旨在提供,也不構成TradingView提供或認可的任何形式的財務、投資、交易或其他類型的建議或推薦。請閱讀使用條款以了解更多資訊。
開源腳本
秉持TradingView一貫精神,這個腳本的創作者將其設為開源,以便交易者檢視並驗證其功能。向作者致敬!您可以免費使用此腳本,但請注意,重新發佈代碼需遵守我們的社群規範。
免責聲明
這些資訊和出版物並非旨在提供,也不構成TradingView提供或認可的任何形式的財務、投資、交易或其他類型的建議或推薦。請閱讀使用條款以了解更多資訊。