OPEN-SOURCE SCRIPT
Apex Cross 13/48 EMA by Fagoe Investments
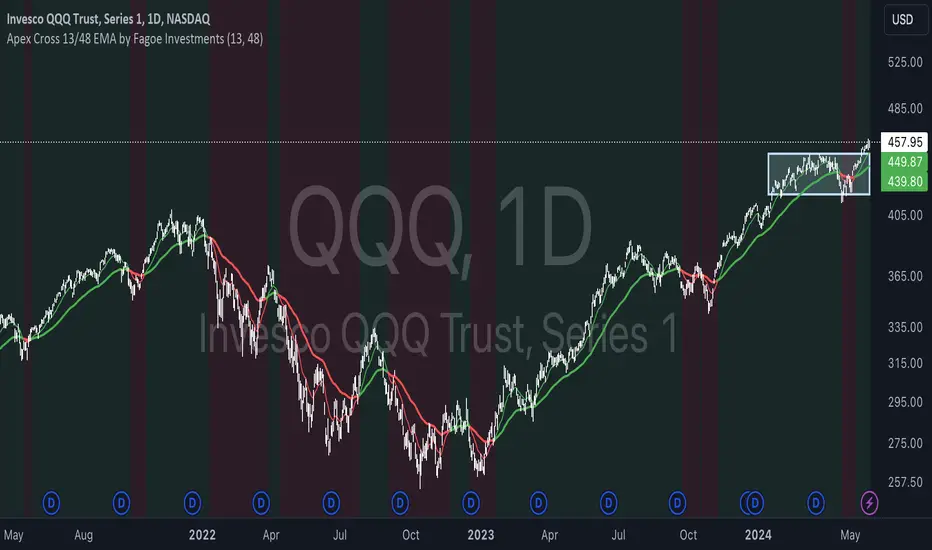
Apex Cross 13/48 EMAis an advanced trading indicator building upon the foundational concept of EMA crossovers but introduces several key advancements for more dynamic and responsive trading analysis.
For example, in the history of Bitcoin there were 34 Apex Crosses with an average return of 26.64%
Key Features:
Why 13/48 EMA Instead of 50/200?
The choice of a 13/48 EMA setup over the traditional 50/200 SMA is inspired by the desire for a quicker response to market changes. Unlike SMAs, which provide a smoother and more generalized view of price trends, EMAs emphasize recent price actions, making them more responsive. The 13/48 EMAs provide a tighter, more responsive curve that can highlight shorter-term trends and potential reversals sooner than the 50/200 SMA, which tends to lag significantly due to its broader data sample. This responsiveness can be particularly advantageous in markets that are less trending and more volatile, where faster reactions are crucial. Additionally, for traders looking to capitalize on shorter trade durations and avoid the broader market noise, the 13/48 setup proves superior.
Feel free to customize the EMA settings to suit your trading style and market conditions, whether you're scanning for quick swings or broader trend confirmations. "Apex Cross 13/48 EMA" is designed for both novice and experienced traders who require precision and adaptability in their technical analysis toolkit.
For example, in the history of Bitcoin there were 34 Apex Crosses with an average return of 26.64%
Key Features:
- Dynamic Background Coloring: Unlike the standard version, "Apex Cross" incorporates subtle background coloring that changes based on the direction of the EMA crossover. This provides a clear, at-a-glance understanding of market trends, enhancing visual analysis.
- Color-Changing EMA Lines: The EMAs themselves change color at the point of intersection, offering immediate visual cues of bullish or bearish transitions.
- Customizable EMA Settings: Users have the flexibility to adjust EMA periods directly from the indicator settings, allowing for the analysis of various EMA intersections beyond the default 13/48 setup.
Why 13/48 EMA Instead of 50/200?
The choice of a 13/48 EMA setup over the traditional 50/200 SMA is inspired by the desire for a quicker response to market changes. Unlike SMAs, which provide a smoother and more generalized view of price trends, EMAs emphasize recent price actions, making them more responsive. The 13/48 EMAs provide a tighter, more responsive curve that can highlight shorter-term trends and potential reversals sooner than the 50/200 SMA, which tends to lag significantly due to its broader data sample. This responsiveness can be particularly advantageous in markets that are less trending and more volatile, where faster reactions are crucial. Additionally, for traders looking to capitalize on shorter trade durations and avoid the broader market noise, the 13/48 setup proves superior.
Feel free to customize the EMA settings to suit your trading style and market conditions, whether you're scanning for quick swings or broader trend confirmations. "Apex Cross 13/48 EMA" is designed for both novice and experienced traders who require precision and adaptability in their technical analysis toolkit.
開源腳本
秉持TradingView一貫精神,這個腳本的創作者將其設為開源,以便交易者檢視並驗證其功能。向作者致敬!您可以免費使用此腳本,但請注意,重新發佈代碼需遵守我們的社群規範。
免責聲明
這些資訊和出版物並非旨在提供,也不構成TradingView提供或認可的任何形式的財務、投資、交易或其他類型的建議或推薦。請閱讀使用條款以了解更多資訊。
開源腳本
秉持TradingView一貫精神,這個腳本的創作者將其設為開源,以便交易者檢視並驗證其功能。向作者致敬!您可以免費使用此腳本,但請注意,重新發佈代碼需遵守我們的社群規範。
免責聲明
這些資訊和出版物並非旨在提供,也不構成TradingView提供或認可的任何形式的財務、投資、交易或其他類型的建議或推薦。請閱讀使用條款以了解更多資訊。