OPEN-SOURCE SCRIPT
New RSI
📌 New RSI
The New RSI is a modern, enhanced version of the classic RSI created in 1978 — redesigned for today’s fast-moving markets, where algorithmic trading and AI dominate price action.
This indicator combines:
Adaptive RSI: Adjusts its calculation length in real time based on market volatility, making it more responsive during high volatility and smoother during calm periods.
Dynamic Bands: Upper and lower bands calculated from historical RSI volatility, helping you spot overbought/oversold conditions with greater accuracy.
Trend & Regime Filters: EMA and ADX-based detection to confirm signals only in favorable market conditions.
Volume Confirmation: Signals appear only when high trading volume supports the move — green volume for bullish setups and red volume for bearish setups — filtering out weak and unreliable trades.
💡 How it works:
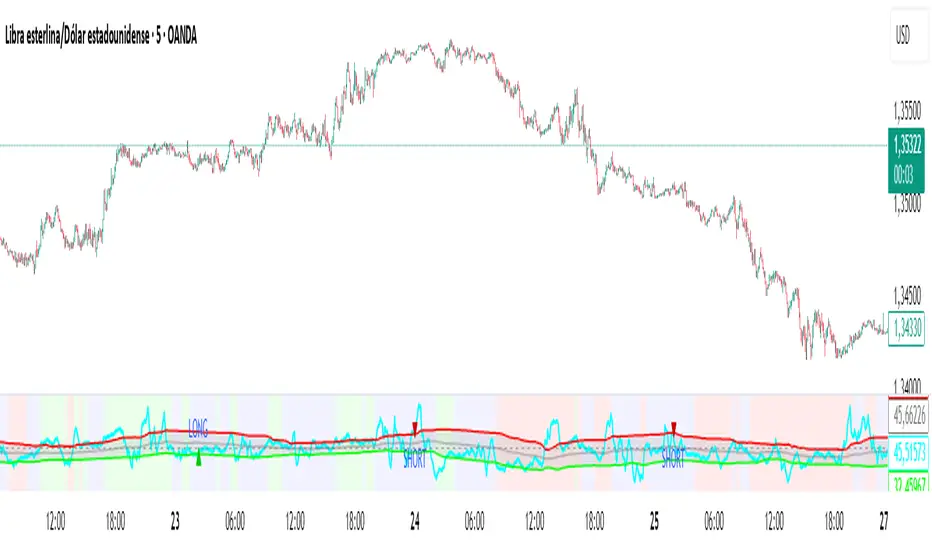
A LONG signal appears when RSI crosses above the lower band and the volume is high with a bullish candle.
A SHORT signal appears when RSI crosses below the upper band and the volume is high with a bearish candle.
Trend and higher timeframe filters (optional) can help improve precision and adapt to different trading styles.
✅ Best Use Cases:
Identify high-probability reversals or pullbacks with strong momentum confirmation.
Avoid false signals by trading only when volume validates the move.
Combine with your own support/resistance or price action strategy for even higher accuracy.
⚙️ Fully Customizable:
Adjustable RSI settings (length, volatility adaptation, smoothing)
Dynamic band sensitivity
Volume threshold multiplier
Higher timeframe RSI filter
Color-coded background for market regime visualization
This is not just another RSI — it’s a complete, next-gen momentum tool designed for traders who want accuracy, adaptability, and confirmation in every signal.
The New RSI is a modern, enhanced version of the classic RSI created in 1978 — redesigned for today’s fast-moving markets, where algorithmic trading and AI dominate price action.
This indicator combines:
Adaptive RSI: Adjusts its calculation length in real time based on market volatility, making it more responsive during high volatility and smoother during calm periods.
Dynamic Bands: Upper and lower bands calculated from historical RSI volatility, helping you spot overbought/oversold conditions with greater accuracy.
Trend & Regime Filters: EMA and ADX-based detection to confirm signals only in favorable market conditions.
Volume Confirmation: Signals appear only when high trading volume supports the move — green volume for bullish setups and red volume for bearish setups — filtering out weak and unreliable trades.
💡 How it works:
A LONG signal appears when RSI crosses above the lower band and the volume is high with a bullish candle.
A SHORT signal appears when RSI crosses below the upper band and the volume is high with a bearish candle.
Trend and higher timeframe filters (optional) can help improve precision and adapt to different trading styles.
✅ Best Use Cases:
Identify high-probability reversals or pullbacks with strong momentum confirmation.
Avoid false signals by trading only when volume validates the move.
Combine with your own support/resistance or price action strategy for even higher accuracy.
⚙️ Fully Customizable:
Adjustable RSI settings (length, volatility adaptation, smoothing)
Dynamic band sensitivity
Volume threshold multiplier
Higher timeframe RSI filter
Color-coded background for market regime visualization
This is not just another RSI — it’s a complete, next-gen momentum tool designed for traders who want accuracy, adaptability, and confirmation in every signal.
開源腳本
秉持TradingView一貫精神,這個腳本的創作者將其設為開源,以便交易者檢視並驗證其功能。向作者致敬!您可以免費使用此腳本,但請注意,重新發佈代碼需遵守我們的社群規範。
免責聲明
這些資訊和出版物並非旨在提供,也不構成TradingView提供或認可的任何形式的財務、投資、交易或其他類型的建議或推薦。請閱讀使用條款以了解更多資訊。
開源腳本
秉持TradingView一貫精神,這個腳本的創作者將其設為開源,以便交易者檢視並驗證其功能。向作者致敬!您可以免費使用此腳本,但請注意,重新發佈代碼需遵守我們的社群規範。
免責聲明
這些資訊和出版物並非旨在提供,也不構成TradingView提供或認可的任何形式的財務、投資、交易或其他類型的建議或推薦。請閱讀使用條款以了解更多資訊。