OPEN-SOURCE SCRIPT
已更新 EQma - Adaptive Smoothing Based On Optimal Markets Detection
Introduction
"You don’t put sunscreen when there is no sun, you don’t use an umbrella when there is no rain, you don’t use a kite when there is no wind, so why would you use a trend following strategy when there is no trend ?"
This is how i start my 4th paper "A New Technical Indicator For Optimal Markets Detection" where i present two new technical indicators. We talked about the first one, running equity, which aim to detect the best moment to enter trades, based on this new metric i made an adaptive moving average.
You can see the full paper here figshare.com/articles/A_New_Technical_Indicator_For_Optimal_Markets_Detection/9825752
The Indicator
The moving average is based on exponential averaging and use a smoothing variable alpha based on the running equity metric, in order to calculate alpha the running equity is divided by the optimal equity which show the best returns possible for the conditions used. Basically the indicator work as follow :
When the running equity is close to the optimal equity it means that the price need no/little filtering since it does not contain information that need to be filtered, therefore alpha is high, however when the running equity is far from the optimal equity this mean that the price posses malign information that need to be removed.
This is why the indicator will be closer to the price when length is high :

See the full paper for an explanation on how this work.
I added various options for the indicator, one will reduce the lag by squaring alpha, thus giving for length = 14 :

The efficient option will make use of recursion to provide a more efficient indicator :

In green the efficient version, note how this option can allow a better fit with the price.
Conclusion
This is an indicator but at its core its rather a framework, if you have read the paper you'll see that the conditions are just 1 and -1 that changes with time, basically its like making a strategy with :
Condition = if buy then 1 else if sell then -1 else Precedent value of condition.
So those two indicators allow to give useful and usable information about your strategy. I hope it can be of use for anyone here, if so don't hesitate to send me what you made using the proposed indicator (and with all my indicators in general). If you are writing a paper and you think this indicator could fit in your work then let me know so i can be aware of it :)
Thanks for reading !
Acknowledgement
My papers are quite ridiculous but they still manage to get some views, some researchers don't even reach those number in so little time which is quite unfortunate but also really motivating for me, so thanks to those who take time to read them and give me some feedback :)
"You don’t put sunscreen when there is no sun, you don’t use an umbrella when there is no rain, you don’t use a kite when there is no wind, so why would you use a trend following strategy when there is no trend ?"
This is how i start my 4th paper "A New Technical Indicator For Optimal Markets Detection" where i present two new technical indicators. We talked about the first one, running equity, which aim to detect the best moment to enter trades, based on this new metric i made an adaptive moving average.
You can see the full paper here figshare.com/articles/A_New_Technical_Indicator_For_Optimal_Markets_Detection/9825752
The Indicator
The moving average is based on exponential averaging and use a smoothing variable alpha based on the running equity metric, in order to calculate alpha the running equity is divided by the optimal equity which show the best returns possible for the conditions used. Basically the indicator work as follow :
When the running equity is close to the optimal equity it means that the price need no/little filtering since it does not contain information that need to be filtered, therefore alpha is high, however when the running equity is far from the optimal equity this mean that the price posses malign information that need to be removed.
This is why the indicator will be closer to the price when length is high :
See the full paper for an explanation on how this work.
I added various options for the indicator, one will reduce the lag by squaring alpha, thus giving for length = 14 :
The efficient option will make use of recursion to provide a more efficient indicator :
In green the efficient version, note how this option can allow a better fit with the price.
Conclusion
This is an indicator but at its core its rather a framework, if you have read the paper you'll see that the conditions are just 1 and -1 that changes with time, basically its like making a strategy with :
Condition = if buy then 1 else if sell then -1 else Precedent value of condition.
So those two indicators allow to give useful and usable information about your strategy. I hope it can be of use for anyone here, if so don't hesitate to send me what you made using the proposed indicator (and with all my indicators in general). If you are writing a paper and you think this indicator could fit in your work then let me know so i can be aware of it :)
Thanks for reading !
Acknowledgement
My papers are quite ridiculous but they still manage to get some views, some researchers don't even reach those number in so little time which is quite unfortunate but also really motivating for me, so thanks to those who take time to read them and give me some feedback :)
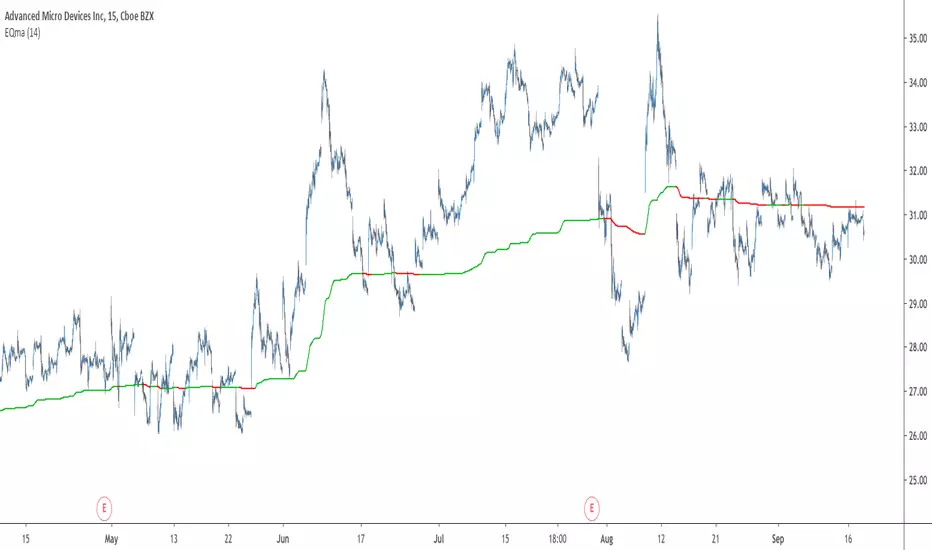
發行說明
Options to change plot color based on indicator direction added.開源腳本
本著TradingView的真正精神,此腳本的創建者將其開源,以便交易者可以查看和驗證其功能。向作者致敬!雖然您可以免費使用它,但請記住,重新發佈程式碼必須遵守我們的網站規則。
Check out the indicators we are making at luxalgo: tradingview.com/u/LuxAlgo/
"My heart is so loud that I can't hear the fireworks"
"My heart is so loud that I can't hear the fireworks"
免責聲明
這些資訊和出版物並不意味著也不構成TradingView提供或認可的金融、投資、交易或其他類型的意見或建議。請在使用條款閱讀更多資訊。
開源腳本
本著TradingView的真正精神,此腳本的創建者將其開源,以便交易者可以查看和驗證其功能。向作者致敬!雖然您可以免費使用它,但請記住,重新發佈程式碼必須遵守我們的網站規則。
Check out the indicators we are making at luxalgo: tradingview.com/u/LuxAlgo/
"My heart is so loud that I can't hear the fireworks"
"My heart is so loud that I can't hear the fireworks"
免責聲明
這些資訊和出版物並不意味著也不構成TradingView提供或認可的金融、投資、交易或其他類型的意見或建議。請在使用條款閱讀更多資訊。