OPEN-SOURCE SCRIPT
RSI MACD EMA Stoch Custom Indicator
Copyright by RJ 3/2018
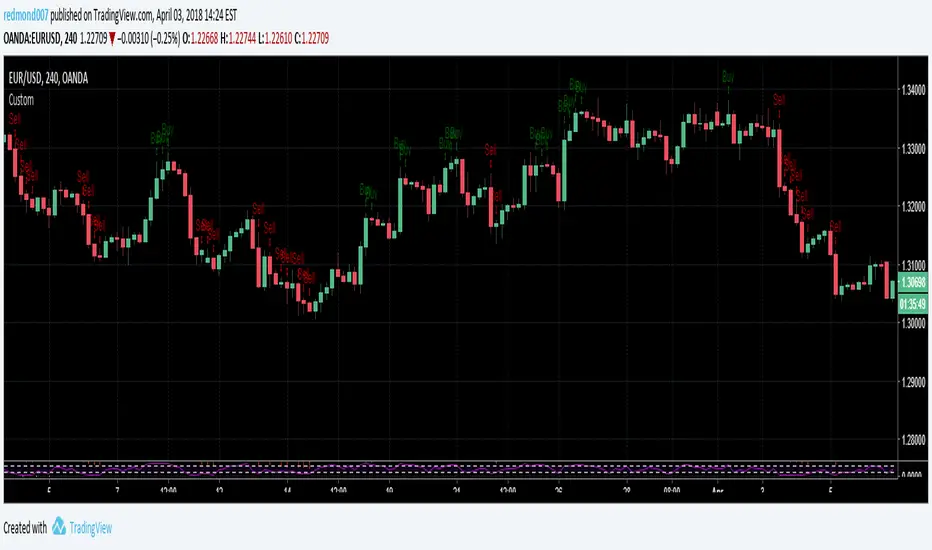
Buy when:
RSI period 3 greater than 50, Difference between MACD and MACD signal line is greater than 0 and also greater than that of previous candle,
Stochastic %D line is less than 80 and greater than that of previous candle, Closing price greater than EMA period 100.
Sell when:
RSI period 3 less than 50, Difference between MACD and MACD signal line is less than 0 and also less than that of
previous candle, Stochastic %D line is greater than 20 and less than that of previous candle, Closing price less than EMA
period 100.
開源腳本
秉持TradingView一貫精神,這個腳本的創作者將其設為開源,以便交易者檢視並驗證其功能。向作者致敬!您可以免費使用此腳本,但請注意,重新發佈代碼需遵守我們的社群規範。
免責聲明
這些資訊和出版物並非旨在提供,也不構成TradingView提供或認可的任何形式的財務、投資、交易或其他類型的建議或推薦。請閱讀使用條款以了解更多資訊。
開源腳本
秉持TradingView一貫精神,這個腳本的創作者將其設為開源,以便交易者檢視並驗證其功能。向作者致敬!您可以免費使用此腳本,但請注意,重新發佈代碼需遵守我們的社群規範。
免責聲明
這些資訊和出版物並非旨在提供,也不構成TradingView提供或認可的任何形式的財務、投資、交易或其他類型的建議或推薦。請閱讀使用條款以了解更多資訊。