OPEN-SOURCE SCRIPT
Study: Candle MA Distance (ATR)
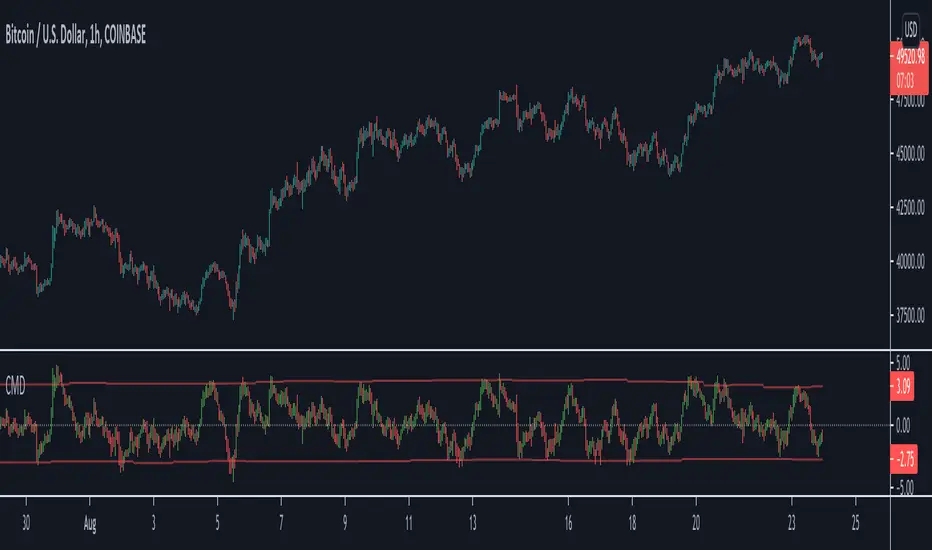
Simple script that plots price to MA distance (ATR) as a bar chart.
ATR is being used here instead of % because ATR keeps it relative to current volatility (1ATR move in either direction can have very different % for when price at 20cent and 2 dollars).
Upper/Lower band is calculated based on the average of previous peak/trough. Price approaching the band could signal overextended in the short term movement, expect price to consolidate/retrace to the MA.
Caution: if the indicator shows the price "pulled back" to MA, the actual price could still go up (or down), just a little slower then the MA
Adjustable Settings:
- Plot as bar or line
- MA Type and Length
- ATR Length
█ Disclaimer
Past performance is not an indicator of future results.
My opinions and research are my own and do not constitute financial advice in any way whatsoever.
Nothing published by me constitutes an investment recommendation, nor should any data or Content published by me be relied upon for any investment/trading activities.
I strongly recommends that you perform your own independent research and/or speak with a qualified investment professional before making any financial decisions.
開源腳本
本著TradingView的真正精神,此腳本的創建者將其開源,以便交易者可以查看和驗證其功能。向作者致敬!雖然您可以免費使用它,但請記住,重新發佈程式碼必須遵守我們的網站規則。
免責聲明
這些資訊和出版物並不意味著也不構成TradingView提供或認可的金融、投資、交易或其他類型的意見或建議。請在使用條款閱讀更多資訊。
開源腳本
本著TradingView的真正精神,此腳本的創建者將其開源,以便交易者可以查看和驗證其功能。向作者致敬!雖然您可以免費使用它,但請記住,重新發佈程式碼必須遵守我們的網站規則。
免責聲明
這些資訊和出版物並不意味著也不構成TradingView提供或認可的金融、投資、交易或其他類型的意見或建議。請在使用條款閱讀更多資訊。