OPEN-SOURCE SCRIPT
Rainbow MA Study
I've been interested in 'Multiple Moving Averages' lately and came across another script on here for a Rainbow MA.
Unfortunately its source is private and I wanted to try things out with other MA types so I put this together.
I also wanted to make it a seperate study so I could view regular bars without the clutter.
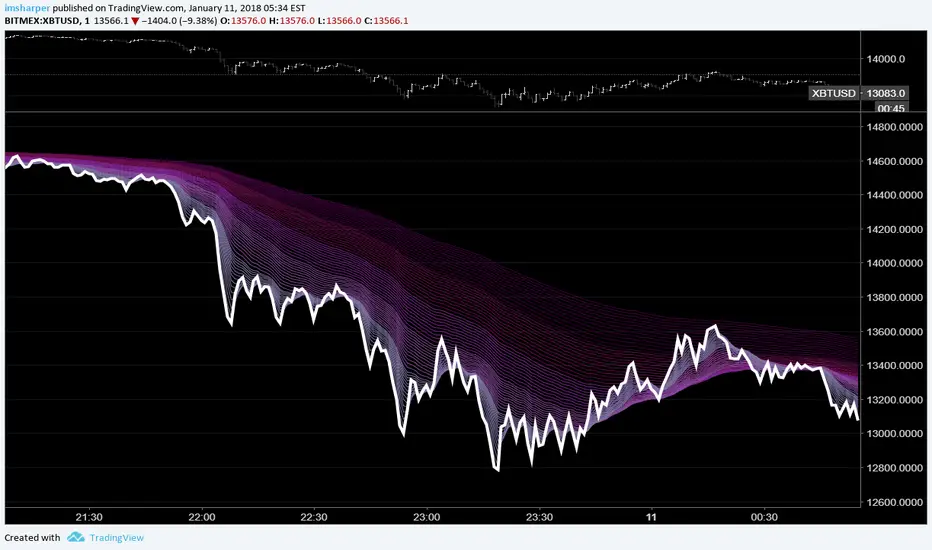
The general rule of thumb with these is the larger the price movement the wider the lines become giving you sort of a wave effect.
When the lines bunch up together you know there's going to be a breakout opportunity that will present itself.
Partly art, partly practical, entirely overkill. Enjoy!
The anchor multiplier should basically allow you to view things in relation to another time period, but it takes forever to load and will likely time out.
Since there are 63 MA's being calculated and plotted changing options on the fly takes some time to process and load.
I'm also pretty new to pine script so it's probably not the best implementation.
MA types: EMA (default), SMA, WMA, VWMA, SMMA, DEMA, TEMA, HullMA, ZEMA, TMA, SSMA
Play around with these to see some different effects.
The white line is the current close price.
Color 1 МАs: 2,3, 4, 5, 6, 7, 8, 9, 10, 11, 12, 13, 14, 15
Color 2 MAs: 17, 19, 21, 23, 25, 27, 29, 31, 33, 35, 37, 39, 41
Color 3 MAs: 44, 47, 50, 53, 56, 59, 62, 65, 68, 71, 74
Color 4 MAs: 78, 82, 86, 90, 94, 98, 102, 106, 110, 114, 118, 122
Color 5 MAs: 126, 131, 137, 143, 149, 155, 155, 161, 167, 173, 179, 185, 191, 197
You can more easily change the colors at the top of this source code instead of one by one in the settings.
If you want this on your main chart instead of a separate window you'll just need to change overlay=true in the study.
References & Thanks:
JustUncleL:
For the timeframe anchor, MA variants, and generally awesome work. This is more practical.
StickyCheeba:
For the idea.
Here's some shots to get an idea of the differences.
HullMA:

VWMA:

SSMA:

TMA:

Unfortunately its source is private and I wanted to try things out with other MA types so I put this together.
I also wanted to make it a seperate study so I could view regular bars without the clutter.
The general rule of thumb with these is the larger the price movement the wider the lines become giving you sort of a wave effect.
When the lines bunch up together you know there's going to be a breakout opportunity that will present itself.
Partly art, partly practical, entirely overkill. Enjoy!
The anchor multiplier should basically allow you to view things in relation to another time period, but it takes forever to load and will likely time out.
Since there are 63 MA's being calculated and plotted changing options on the fly takes some time to process and load.
I'm also pretty new to pine script so it's probably not the best implementation.
MA types: EMA (default), SMA, WMA, VWMA, SMMA, DEMA, TEMA, HullMA, ZEMA, TMA, SSMA
Play around with these to see some different effects.
The white line is the current close price.
Color 1 МАs: 2,3, 4, 5, 6, 7, 8, 9, 10, 11, 12, 13, 14, 15
Color 2 MAs: 17, 19, 21, 23, 25, 27, 29, 31, 33, 35, 37, 39, 41
Color 3 MAs: 44, 47, 50, 53, 56, 59, 62, 65, 68, 71, 74
Color 4 MAs: 78, 82, 86, 90, 94, 98, 102, 106, 110, 114, 118, 122
Color 5 MAs: 126, 131, 137, 143, 149, 155, 155, 161, 167, 173, 179, 185, 191, 197
You can more easily change the colors at the top of this source code instead of one by one in the settings.
If you want this on your main chart instead of a separate window you'll just need to change overlay=true in the study.
References & Thanks:
JustUncleL:
For the timeframe anchor, MA variants, and generally awesome work. This is more practical.
StickyCheeba:
For the idea.
Here's some shots to get an idea of the differences.
HullMA:
VWMA:
SSMA:
TMA:
開源腳本
秉持TradingView一貫精神,這個腳本的創作者將其設為開源,以便交易者檢視並驗證其功能。向作者致敬!您可以免費使用此腳本,但請注意,重新發佈代碼需遵守我們的社群規範。
免責聲明
這些資訊和出版物並非旨在提供,也不構成TradingView提供或認可的任何形式的財務、投資、交易或其他類型的建議或推薦。請閱讀使用條款以了解更多資訊。
免責聲明
這些資訊和出版物並非旨在提供,也不構成TradingView提供或認可的任何形式的財務、投資、交易或其他類型的建議或推薦。請閱讀使用條款以了解更多資訊。