OPEN-SOURCE SCRIPT
已更新 Parabolic SAR Deviation [BigBeluga]
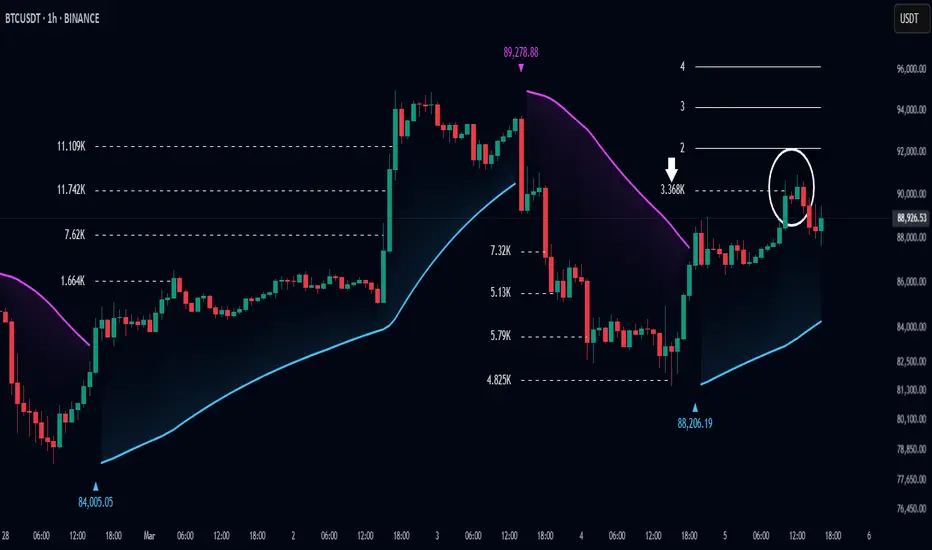
Parabolic SAR + Deviation [BigBeluga] is an enhanced Parabolic SAR indicator designed to detect trends while incorporating deviation levels and trend change markers for added depth in analyzing price movements.
🔵Key Features:
> Parabolic SAR with Optimized Settings:
🔵Usage:
Parabolic SAR + Deviation [BigBeluga] is an essential tool for traders seeking a straightforward yet powerful method to identify trends, analyze price deviations, and gain insights into volume dynamics at critical breakout and trend change levels.
🔵Key Features:
> Parabolic SAR with Optimized Settings:
- Built on the classic Parabolic SAR, this version uses predefined default settings to enhance its ability to detect and confirm trends.
- Clear trend direction is indicated by smooth trend lines, allowing traders to easily visualize market movements.
- Trend Change Markers:
- When a trend change occurs based on the SAR, the indicator plots a triangle at the trend change point.
- The triangle is accompanied by the price value of the trend change, allowing traders to identify key reversal points instantly.
> Deviation Levels:
- Four deviation levels are automatically plotted when a trend change occurs (up or down).
- Uptrend: Deviation levels are positioned above the entry point.
- Downtrend: Deviation levels are positioned below the entry point.
- Levels are labeled with numbers 1 to 4, representing increasing degrees of deviation.
> Dynamic Level Updates: - When the price crosses a deviation level, the level becomes dashed and its label changes to display the volume at the breakout point.
- This volume information helps traders assess the strength of the breakout and the potential for trend continuation or reversal.
> Volume Analysis at Breakpoints: - The volume displayed at crossed deviation levels provides insight into the strength of the price movement.
- High volume at a breakout may indicate strong momentum, while low volume could signal potential exhaustion or a false breakout.
🔵Usage:
- Identify Trends: Use the trend change triangles and smooth SAR trend lines to confirm whether the market is trending up or down.
- Analyze Deviation Levels: Monitor deviation levels **1–4** to identify potential breakout points and assess the degree of price deviation from the entry point.
- Observe Trend Change Points: Utilize the triangles and price labels to quickly spot significant trend changes.
- Volume Insights: Evaluate the volume displayed at crossed levels to determine the strength of the breakout and assess the likelihood of trend continuation or reversal.
- Risk Management: Use deviation levels as potential stop-loss or take-profit zones, depending on the strength of the trend and volume conditions.
Parabolic SAR + Deviation [BigBeluga] is an essential tool for traders seeking a straightforward yet powerful method to identify trends, analyze price deviations, and gain insights into volume dynamics at critical breakout and trend change levels.
發行說明
- Bug fix of lines and labels arrays開源腳本
秉持TradingView一貫精神,這個腳本的創作者將其設為開源,以便交易者檢視並驗證其功能。向作者致敬!您可以免費使用此腳本,但請注意,重新發佈代碼需遵守我們的社群規範。
🔵Gain access to our powerful tools : bigbeluga.com/tv
🔵Join our free discord for updates : bigbeluga.com/discord
All scripts & content provided by BigBeluga are for informational & educational purposes only.
🔵Join our free discord for updates : bigbeluga.com/discord
All scripts & content provided by BigBeluga are for informational & educational purposes only.
免責聲明
這些資訊和出版物並非旨在提供,也不構成TradingView提供或認可的任何形式的財務、投資、交易或其他類型的建議或推薦。請閱讀使用條款以了解更多資訊。
開源腳本
秉持TradingView一貫精神,這個腳本的創作者將其設為開源,以便交易者檢視並驗證其功能。向作者致敬!您可以免費使用此腳本,但請注意,重新發佈代碼需遵守我們的社群規範。
🔵Gain access to our powerful tools : bigbeluga.com/tv
🔵Join our free discord for updates : bigbeluga.com/discord
All scripts & content provided by BigBeluga are for informational & educational purposes only.
🔵Join our free discord for updates : bigbeluga.com/discord
All scripts & content provided by BigBeluga are for informational & educational purposes only.
免責聲明
這些資訊和出版物並非旨在提供,也不構成TradingView提供或認可的任何形式的財務、投資、交易或其他類型的建議或推薦。請閱讀使用條款以了解更多資訊。