PROTECTED SOURCE SCRIPT
Local Top & Bottom
This indicator looks at the rate of price change vs the rate of volume change. However, it does not look at all the volume. It looks at a predefined average volume. Then compares with red or green bar. It looks at the wick sizes compared with the body of the bar. It does this for previous certain number of bars. Also, It looks at how fast the wicks are increasing or decreasing at run time & in which directon for a bar.
Considering all these and a few more things, it then tries to assume whether next bar or next few bars may be down or up.
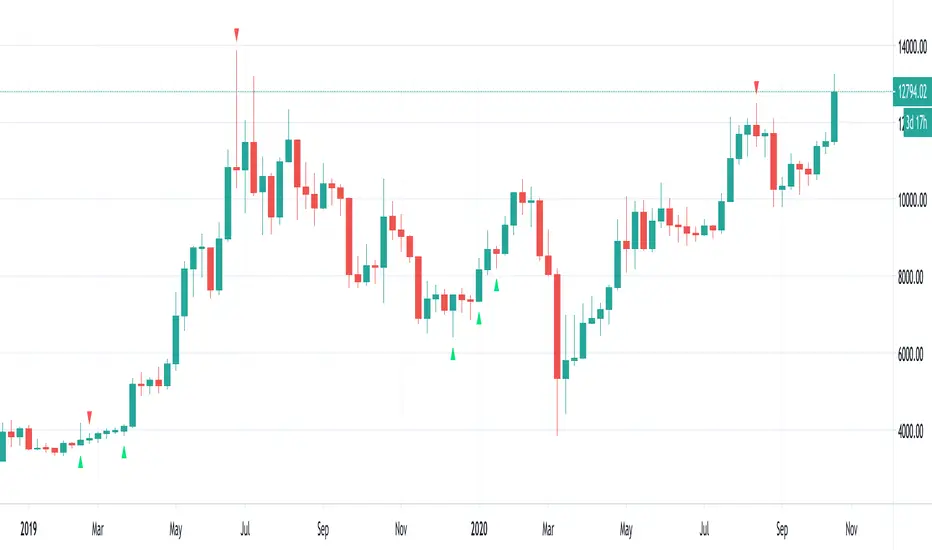
I call these local top and local bottom. It is better to wait for bar close.
The arrows point in which direction it is assuming the price will go.
I have not back tested it. Hence, I am not certain how great it will work in real life.
I will try to revise this as I go along.
Do note that the source code will not be revealed because I do not want to reveal the source code. However you are free to use it as it is without needing my permission.
Invalidation:
* If there is an arrow pointing up but the one of the next bar breaches the low of this bar, then this is invalidated
* if the arrow is point down but any of the next bar breaches the top of the bar, then this is invalidated
Considering all these and a few more things, it then tries to assume whether next bar or next few bars may be down or up.
I call these local top and local bottom. It is better to wait for bar close.
The arrows point in which direction it is assuming the price will go.
I have not back tested it. Hence, I am not certain how great it will work in real life.
I will try to revise this as I go along.
Do note that the source code will not be revealed because I do not want to reveal the source code. However you are free to use it as it is without needing my permission.
Invalidation:
* If there is an arrow pointing up but the one of the next bar breaches the low of this bar, then this is invalidated
* if the arrow is point down but any of the next bar breaches the top of the bar, then this is invalidated
受保護腳本
此腳本以閉源形式發佈。 不過,您可以自由使用,沒有任何限制 — 點擊此處了解更多。
For guides on how to use the Aladdin indicator or how to buy it, please check joy-bangla.gitbook.io/aladdin/
免責聲明
這些資訊和出版物並非旨在提供,也不構成TradingView提供或認可的任何形式的財務、投資、交易或其他類型的建議或推薦。請閱讀使用條款以了解更多資訊。
受保護腳本
此腳本以閉源形式發佈。 不過,您可以自由使用,沒有任何限制 — 點擊此處了解更多。
For guides on how to use the Aladdin indicator or how to buy it, please check joy-bangla.gitbook.io/aladdin/
免責聲明
這些資訊和出版物並非旨在提供,也不構成TradingView提供或認可的任何形式的財務、投資、交易或其他類型的建議或推薦。請閱讀使用條款以了解更多資訊。