OPEN-SOURCE SCRIPT
已更新 SMAs Ghost in the Machine v3
SMAs Ghost in the Machine v3
Created by: MecarderoAurum
Overview
The "SMAs Ghost in the Machine" is a powerful multi-timeframe analysis tool designed for traders who want to align their entries and exits with the trend on several different chart periods simultaneously. At its core, the indicator plots the 9-period and 20-period Simple Moving Averages (SMAs) from up to three user-defined timeframes directly onto your active chart.
Its most powerful feature is the Combined Crossover Signal, which allows you to create highly specific, custom trading setups by defining conditions that must occur at the same time across any of the enabled timeframes. This eliminates guesswork and helps you visually confirm when your precise market conditions are met.
Important Note on Line Drawing
This indicator allows you to see trends of other timeframes. A specific design choice was made not to smooth the moving average lines. This is to ensure that the crossover signals appear on the exact candle where the cross occurs in real-time. Smoothing the lines can cause a delay and shift the signal to a later candle.
The side effect of this accuracy is that the lines will appear "stepped." As new data comes in on your current chart, you may need to refresh the chart to keep the higher timeframe lines updated. We are working on a solution to this.
Capabilities
Multi-Timeframe Analysis: Plot the 9 and 20 SMAs from three different timeframes (e.g., 1-minute, 5-minute, and 30-minute) on a single chart.
Individual Crossover Signals: Automatically plots a green triangle (▲) for a "Golden Cross" (9 SMA crosses above 20) and a red triangle (▼) for a "Death Cross" (9 SMA crosses below 20) on each individual timeframe.
Combined Crossover Engine: Define a custom bullish or bearish signal by combining multiple events. The indicator will plot a green diamond (◆) for your bullish setup and a red diamond (◆) for your bearish setup when all specified conditions are met on the same candle.
Customizable Alerts: Create alerts for both the individual 9/20 SMA crosses and your custom Combined Crossover Signal to ensure you never miss a potential setup.
How to Use the Indicator
Basic Setup
Add the "SMAs Ghost in the Machine v3" indicator to your TradingView chart.
Open the indicator settings.
Under the Timeframe Settings, enable the timeframes you want to monitor and select the desired period for each (e.g., TF1: '1', TF2: '5', TF3: '30').
Configuring the Combined Crossover Signal
This is the core feature for defining your specific trading setups.
In the settings, go to the "Combined Crossover Signal" group and check the box to "Enable Combined Signal."
Decide if you are building a bullish (long) or bearish (short) setup.
Under the "Bullish Setup" or "Bearish Setup" sections, check the boxes for every event that must happen at the same time for your signal to trigger.
Example Bullish Setup:
Let's say your strategy is to go long when:
On the 1-minute chart (TF1), the price crosses above the 9 SMA.
AND, on the 5-minute chart (TF3), the price also crosses above its 9 SMA.
To configure this, you would check the following two boxes under the "Bullish Setup":
TF1: Price crosses above 9 SMA
TF3: Price crosses above 9 SMA
Now, a green diamond (◆) will only appear on your chart when both of those conditions are true on the exact same bar, giving you a precise entry signal.
Setting Up Alerts
Go to the "Alert Settings" tab in the indicator options.
Check the boxes for the alerts you want to enable (e.g., "Alert on TF1 SMA Cross," "Alert on Combined Signal").
Close the settings. Now, right-click on the chart and choose "Add alert."
In the "Condition" dropdown, select "SMA Ghosts v3."
A second dropdown will appear. Choose the specific event you want an alert for, such as Combined Bullish Signal or TF1 Golden Cross.
Configure the alert options as desired and click "Create."
Trading Strategies
Trend Confirmation: Use the indicator on a 1-minute chart with the 5-minute 9/20 SMA lines enabled to see the 5-minute trend. Only take 1-minute trades that are in the same direction as the 5-minute SMAs.
Multi-Flow Alignment: Keep track of bigger timeframes (like the 30-min or 4-hour) to also match your entries with longer-term market flows.
Avoid Flat Markets: Avoid taking trades when the SMA lines from multiple timeframes are flat or moving sideways, as this indicates a lack of clear trend.
發行說明
SMAs Ghost in the Machine v5Created by: MecarderoAurum
Overview
The "SMAs Ghost in the Machine" is a powerful multi-timeframe analysis tool designed for traders who want to align their entries and exits with the trend on several different chart periods simultaneously. At its core, the indicator plots the 9-period and 20-period Simple Moving Averages (SMAs) from your current chart and up to three user-defined higher timeframes directly onto your active chart.
Its most powerful feature is the Combined Crossover Signal, which allows you to create highly specific, custom trading setups by defining conditions that must occur at the same time across any of the enabled timeframes. This eliminates guesswork and helps you visually confirm when your precise market conditions are met.
IMPORTANT NOTE ON LINE BEHAVIOR:
The higher timeframe lines use live data to be as accurate as possible in real-time. This means the most current segment of the line will move and adjust until the higher timeframe bar closes. This is known as "repainting" and is necessary to provide live data without lag. Unfortunately, having a line that does not repaint caused enough lag to make it unuseful and we will have to deal with this repainting issue until PineScript has a better option.
Capabilities
Multi-Timeframe Analysis: Plot the 9 and 20 SMAs from your current chart and up to three different higher timeframes (e.g., 1-minute, 5-minute, and 30-minute) on a single chart.
Individual Crossover Signals: Automatically plots a triangle symbol for a "Golden Cross" (9 SMA crosses above 20) and a "Death Cross" (9 SMA crosses below 20) on each individual timeframe.
Combined Crossover Engine: Define a custom bullish or bearish signal by combining multiple events across any of the available timeframes (current and higher). The indicator will plot a green diamond (◆) for your bullish setup and a red diamond (◆) for your bearish setup when all specified conditions are met on the same candle.
Customizable Alerts: Create alerts for both the individual 9/20 SMA crosses and your custom Combined Crossover Signal to ensure you never miss a potential setup.
How to Use the Indicator
Basic Setup
Add the "SMAs Ghost in the Machine v5" indicator to your TradingView chart.
Open the indicator settings.
Under "Current Timeframe SMAs," you can enable/disable and set the colors for the standard 9/20 SMAs on your active chart.
Under the "Higher Timeframe Settings," enable the timeframes you want to monitor and select the desired period for each (e.g., TF1: '5', TF2: '30').
Configuring the Combined Crossover Signal
This is the core feature for defining your specific trading setups.
In the settings, go to the "Combined Crossover Signal" group and check the box to "Enable Combined Signal."
Decide if you are building a bullish (long) or bearish (short) setup.
Under the "Bullish Setup" or "Bearish Setup" sections, check the boxes for every event that must happen at the same time for your signal to trigger.
Example Bullish Setup:
Let's say your strategy is to go long when:
On the 1-minute chart (CTF), the price crosses above the 9 SMA.
AND, on the 5-minute chart (TF1), the price also crosses above its 9 SMA.
To configure this, you would check the following two boxes under the "Bullish Setup":
CTF: Price crosses above 9 SMA
TF1: Price crosses above 9 SMA
Now, a green diamond (◆) will only appear on your chart when both of those conditions are true on the exact same bar, giving you a precise entry signal.
Setting Up Alerts
Go to the "Alert Settings" tab in the indicator options.
Check the boxes for the alerts you want to enable (e.g., "Alert on TF1 SMA Cross," "Alert on Combined Signal").
Close the settings. Now, right-click on the chart and choose "Add alert."
In the "Condition" dropdown, select "SMA Ghosts v5."
A second dropdown will appear. Choose the specific event you want an alert for, such as Combined Bullish Signal or TF1 Golden Cross.
Configure the alert options as desired and click "Create."
Trading Strategies
Trend Confirmation: Use the indicator on a 1-minute chart with the 5-minute 9/20 SMA lines enabled to see the 5-minute trend. Only take 1-minute trades that are in the same direction as the 5-minute SMAs.
Multi-Flow Alignment: Keep track of bigger timeframes (like the 30-min or 4-hour) to also match your entries with longer-term market flows.
Avoid Flat Markets: Avoid taking trades when the SMA lines from multiple timeframes are flat or moving sideways, as this indicates a lack of clear trend.
發行說明
SMAs Ghost in the Machine v3Unlock a new dimension of market insight by visualizing multiple trends on a single chart. The "SMAs Ghost in the Machine" indicator for TradingView is a powerful tool designed to give you a decisive edge by revealing the hidden interplay between different market timeframes.
See the Full Picture
Successful trading often comes down to context. A trend on a 5-minute chart might be a minor pullback on a 4-hour chart. This indicator solves that problem by plotting the 9-period and 20-period Simple Moving Averages (SMAs) from up to four distinct timeframes—the one you're currently viewing, plus three others of your choice—directly onto your chart.
Instead of constantly switching between timeframes, you get an immediate, comprehensive view of short-term, medium-term, and long-term trends, all at once.
Key Features
Multi-Timeframe Analysis: Plot the 9 and 20 SMAs for your current chart timeframe and up to three additional, fully configurable timeframes (e.g., 5-min, 30-min, 4-hour).
Clear Crossover Signals: Automatic plotting of triangles for every individual "Golden Cross" (9 SMA over 20 SMA) and "Death Cross" (9 SMA under 20 SMA) on all enabled timeframes.
High-Confluence "Combined Signal": This is the indicator's most powerful feature. Define your own custom, multi-part conditions for a perfect setup. A unique diamond symbol will appear only when all your chosen bullish or bearish events happen simultaneously across any of the active timeframes.
Fully Customizable: Control which timeframes are active, which conditions trigger the Combined Signal, and enable or disable alerts for any crossover event.
Timely & Responsive Signals: The indicator intentionally uses non-smoothed data for its calculations. While smoothed lines might look cleaner, they introduce significant lag. Our approach ensures the crossover signals you see are as close to real-time as possible.
Trading Strategy & How to Use
The core strategy behind this indicator is trend confluence. The highest-probability trades occur when multiple timeframes are in agreement.
Establish the Dominant Trend: Use the longer timeframes (e.g., 4-hour or Daily) as your guide. Are they in a clear uptrend or downtrend? These SMAs act as major levels of support and resistance.
Identify Your Entry Timeframe: Use the shorter timeframes (e.g., current chart, 5-min, 30-min) for your entries. The default settings are optimized for intraday trading, where the current and 5-minute SMAs define the immediate trend.
Wait for Confluence: The ideal entry is a crossover signal on your shorter timeframe that moves in the same direction as the dominant, longer-term trend. For example, if the 4-hour SMAs are trending up, look for a bullish "Golden Cross" or a bullish "Combined Signal" on the 5-minute chart.
Use the Combined Signal for Precision: Configure the "Combined Crossover Signal" to find your perfect entry. For example, you could set a bullish signal to appear only when:
The price on your current chart crosses above the 9 SMA.
AND the price also crosses above the 30-minute 9 SMA.
This ensures you are not just entering on a local move but on one that has strength from a higher timeframe.
Avoid Choppy Markets: If the SMA lines on multiple timeframes are flat and tangled together, it signals a lack of a clear trend. This is a good time to stay out of the market and wait for clarity.
By layering the "ghosts" of higher timeframe trends onto your primary chart, you can trade with greater confidence, avoid false signals, and align your strategy with the market's true momentum.
發行說明
SMAs Ghost in the Machine v3Created by: MercaderoAurum
Description
This script is a powerful multi-timeframe analysis tool designed to visualize trend confluence across the market. It plots the 9 and 20-period Simple Moving Averages (SMAs) not only for the current chart's timeframe but also for up to three higher, user-defined timeframes.
By projecting these higher timeframe SMAs—the "Ghosts"—onto your active chart, you can instantly see how short-term price action is interacting with the underlying, longer-term market structure. This provides a clear and immediate view of whether the market's various "gears" are turning in the same direction, helping you make more informed trading decisions.
Key Features & How to Use Them
This indicator is packed with features that give you granular control over what you see and when you are alerted.
1. Multi-Timeframe SMAs
What it does: Plots the 9 SMA (yellow/green) and 20 SMA (white/red) for four different timeframes simultaneously.
How to use it: In the settings, under each timeframe tab ("Current Timeframe," "Timeframe 1," etc.), you can use the "Enable SMAs" checkbox to turn the SMA lines on or off. This allows you to keep your chart clean by only showing the timeframes that are relevant to your current analysis.
2. Dynamic Crossover Signals & Labels
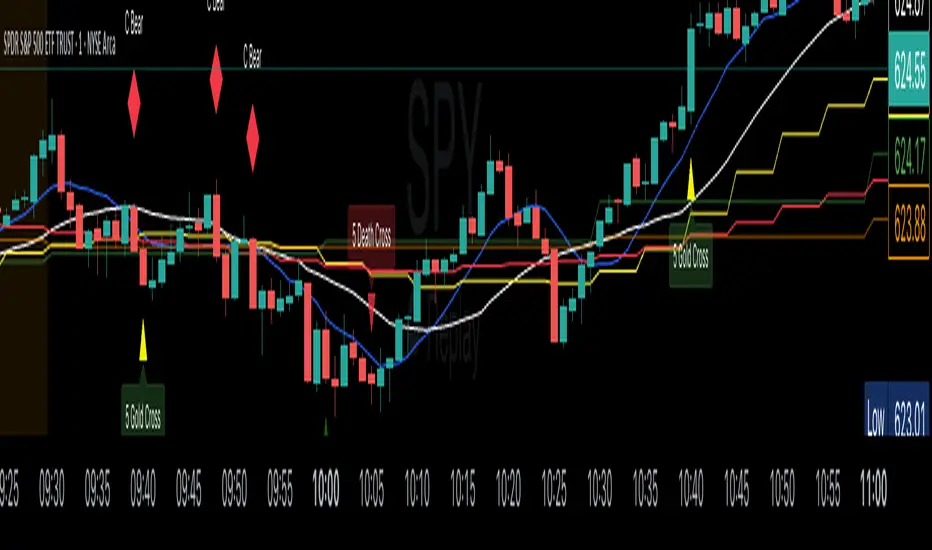
What it does: Automatically plots a shape (triangle) and a text label (e.g., "5min Death Cross") whenever a 9/20 SMA crossover occurs on an enabled timeframe.
How to use it:
"Show Crossover Signals": In each timeframe's settings, this checkbox lets you show or hide the crossover triangles and labels for that specific timeframe. This is perfect for when you want to see the SMA lines for support/resistance but don't want the crossover "noise."
"Show Crossover Text Labels": This is a master switch in the "Style & Display Settings" tab. Uncheck this to hide all text labels, leaving only the triangles for a cleaner chart view.
3. Light & Dark Mode Compatibility
What it does: Ensures the on-chart text labels are readable regardless of your chart's theme.
How to use it: In the "Style & Display Settings" tab, use the "Use White Text for Labels (Dark Mode)" checkbox.
Checked (Default): Text will be white, which is perfect for dark chart backgrounds.
Unchecked: Text will be black, which is ideal for light chart backgrounds.
4. The Combined Signal
What it does: This is a highly advanced feature that plots a special diamond shape ("C Bull" or "C Bear") only when a specific combination of conditions that you define occurs at the same time.
How to use it: In the "Combined Crossover Signal" section, you can build your own custom, high-conviction setup. For example, you can set it to only trigger a "C Bull" signal if a 1-minute Golden Cross happens and the price simultaneously crosses above the 5-minute 9 SMA.
5. Fully Customizable Alerts
What it does: Allows you to create pop-up, email, or webhook alerts for any crossover event.
How to use it: In the "Alert Settings" tab, you can enable alerts for each individual timeframe's crossovers, as well as for the powerful Combined Signal. When setting up the alert in TradingView, be sure to select "Any alert() function call" to receive the detailed, custom messages from the script.
Sample Trading Strategy: The Confluence Confirmation
This strategy focuses on using the higher timeframe signals to confirm the validity of a lower timeframe entry.
Chart Setup:
Chart Timeframe: 1-minute (for precise entries).
Indicator Settings:
Enable SMAs and Signals for Current Timeframe (1-min).
Enable SMAs and Signals for Timeframe 1 and set it to 5 minutes.
Enable SMAs for Timeframe 2 and set it to 30 minutes, but uncheck "Show Crossover Signals" (we only want the lines for context).
Execution Plan (Short Position):
Initial Signal: Wait for a "1 Death Cross" label to appear on your 1-minute chart. This is your initial signal that short-term momentum is shifting downwards. Price should be below both the 1-min 9 and 20 SMAs.
The Confirmation: Do not enter yet. Now, you wait for confirmation from the higher timeframe. As the price continues to move down, you are watching for a "5 Death Cross" label to appear.
Entry: The moment the "5 Death Cross" label prints on your 1-minute chart is your high-probability entry signal. This confirms that the 5-minute momentum has now aligned with the 1-minute momentum, significantly increasing the odds of a continued move down.
Context: Throughout this process, observe how the price is reacting to the 30-minute SMA lines. If the price is also below the 30-minute SMAs, the trade has an even higher probability of success.
By waiting for this confluence—the alignment of the 1-minute and 5-minute trends—you filter out many weak or false signals and only enter trades that have the backing of higher timeframe momentum.
發行說明
SMAs Ghost in the Machine v3.1Created by: MercaderoAurum
Description
This script is a powerful multi-timeframe analysis tool designed to visualize trend confluence across the market. It plots the 9 and 20-period Simple Moving Averages (SMAs) not only for the current chart's timeframe but also for up to three higher, user-defined timeframes.
By projecting these higher timeframe SMAs—the "Ghosts"—onto your active chart, you can instantly see how short-term price action is interacting with the underlying, longer-term market structure. This provides a clear and immediate view of whether the market's various "gears" are turning in the same direction, helping you make more informed trading decisions.
Key Features & How to Use Them
This indicator is packed with features that give you granular control over what you see and when you are alerted.
1. Multi-Timeframe SMAs
What it does: Plots the 9 SMA (yellow/green) and 20 SMA (white/red) for four different timeframes simultaneously.
How to use it: In the settings, under each timeframe tab ("Current Timeframe," "Timeframe 1," etc.), you can use the "Enable SMAs" checkbox to turn the SMA lines on or off. This allows you to keep your chart clean by only showing the timeframes that are relevant to your current analysis.
2. Dynamic Crossover Signals & Labels
What it does: Automatically plots a shape (triangle) and a text label (e.g., "5min Death Cross") whenever a 9/20 SMA crossover occurs on an enabled timeframe.
How to use it:
"Show Crossover Signals": In each timeframe's settings, this checkbox lets you show or hide the crossover triangles and labels for that specific timeframe. This is perfect for when you want to see the SMA lines for support/resistance but don't want the crossover "noise."
"Show Crossover Text Labels": This is a master switch in the "Style & Display Settings" tab. Uncheck this to hide all text labels, leaving only the triangles for a cleaner chart view.
3. Light & Dark Mode Compatibility
What it does: Ensures the on-chart text labels are readable regardless of your chart's theme.
How to use it: In the "Style & Display Settings" tab, use the "Use White Text for Labels (Dark Mode)" checkbox.
Checked (Default): Text will be white, which is perfect for dark chart backgrounds.
Unchecked: Text will be black, which is ideal for light chart backgrounds.
4. The Combined Signal
What it does: This is a highly advanced feature that plots a special diamond shape ("C Bull" or "C Bear") only when a specific combination of conditions that you define occurs at the same time.
How to use it: In the "Combined Crossover Signal" section, you can build your own custom, high-conviction setup. For example, you can set it to only trigger a "C Bull" signal if a 1-minute Golden Cross happens and the price simultaneously crosses above the 5-minute 9 SMA.
5. Fully Customizable Alerts
What it does: Allows you to create pop-up, email, or webhook alerts for any crossover event.
How to use it: In the "Alert Settings" tab, you can enable alerts for each individual timeframe's crossovers, as well as for the powerful Combined Signal. When setting up the alert in TradingView, be sure to select "Any alert() function call" to receive the detailed, custom messages from the script.
Sample Trading Strategy: The Confluence Confirmation
This strategy focuses on using the higher timeframe signals to confirm the validity of a lower timeframe entry.
Chart Setup:
Chart Timeframe: 1-minute (for precise entries).
Indicator Settings:
Enable SMAs and Signals for Current Timeframe (1-min).
Enable SMAs and Signals for Timeframe 1 and set it to 5 minutes.
Enable SMAs for Timeframe 2 and set it to 30 minutes, but uncheck "Show Crossover Signals" (we only want the lines for context).
Execution Plan (Short Position):
Initial Signal: Wait for a "1 Death Cross" label to appear on your 1-minute chart. This is your initial signal that short-term momentum is shifting downwards. Price should be below both the 1-min 9 and 20 SMAs.
The Confirmation: Do not enter yet. Now, you wait for confirmation from the higher timeframe. As the price continues to move down, you are watching for a "5 Death Cross" label to appear.
Entry: The moment the "5 Death Cross" label prints on your 1-minute chart is your high-probability entry signal. This confirms that the 5-minute momentum has now aligned with the 1-minute momentum, significantly increasing the odds of a continued move down.
Context: Throughout this process, observe how the price is reacting to the 30-minute SMA lines. If the price is also below the 30-minute SMAs, the trade has an even higher probability of success.
By waiting for this confluence—the alignment of the 1-minute and 5-minute trends—you filter out many weak or false signals and only enter trades that have the backing of higher timeframe momentum.
開源腳本
秉持TradingView一貫精神,這個腳本的創作者將其設為開源,以便交易者檢視並驗證其功能。向作者致敬!您可以免費使用此腳本,但請注意,重新發佈代碼需遵守我們的社群規範。
免責聲明
這些資訊和出版物並非旨在提供,也不構成TradingView提供或認可的任何形式的財務、投資、交易或其他類型的建議或推薦。請閱讀使用條款以了解更多資訊。
開源腳本
秉持TradingView一貫精神,這個腳本的創作者將其設為開源,以便交易者檢視並驗證其功能。向作者致敬!您可以免費使用此腳本,但請注意,重新發佈代碼需遵守我們的社群規範。
免責聲明
這些資訊和出版物並非旨在提供,也不構成TradingView提供或認可的任何形式的財務、投資、交易或其他類型的建議或推薦。請閱讀使用條款以了解更多資訊。