OPEN-SOURCE SCRIPT
MSRanges

📖 Market Structure with Ranges —
What this script does
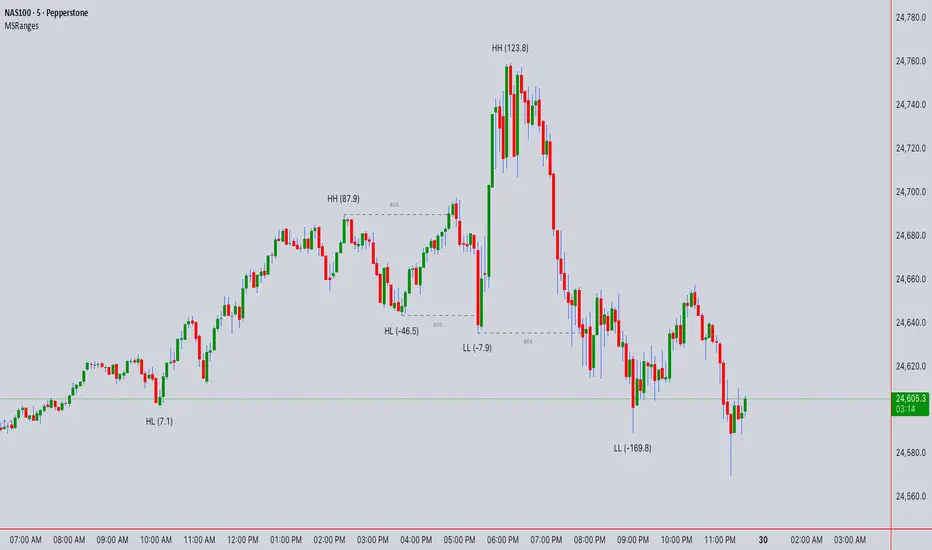
This indicator highlights market structure on any symbol or timeframe. It automatically marks:
Swing points: Higher High (HH), Lower High (LH), Higher Low (HL), Lower Low (LL).
Break of Structure (BOS) and optional Change of Character (CHoCH) events.
Price ranges: each new swing label shows the difference from the last swing in price units (e.g. HH (54.8) or LL (-169.5)).
This lets you see at a glance whether the market is trending, consolidating, or shifting character.
How it works
Range calculation
Inputs & customization
How to use in practice
Trend identification:
Breakout confirmation:
Reversal watch:
Range analysis:
Best practices
Technical notes
Disclaimer
This script is for educational purposes only. It is not financial advice and should not be used as a sole basis for trading decisions. Past performance of any method or indicator does not guarantee future results. Always test on demo accounts and apply proper risk management.
What this script does
This indicator highlights market structure on any symbol or timeframe. It automatically marks:
Swing points: Higher High (HH), Lower High (LH), Higher Low (HL), Lower Low (LL).
Break of Structure (BOS) and optional Change of Character (CHoCH) events.
Price ranges: each new swing label shows the difference from the last swing in price units (e.g. HH (54.8) or LL (-169.5)).
This lets you see at a glance whether the market is trending, consolidating, or shifting character.
How it works
- Pivot detection
Uses TradingView’s ta.pivothigh / ta.pivotlow with a user-set Swing Length.
A pivot is confirmed only after the right-hand bars pass, so labels appear with a delay equal to Swing Length.
- Swing classification
Each new pivot is compared with the previous pivot:
If a new high is higher than the last → HH.
If a new high is lower → LH.
If a new low is higher → HL.
If a new low is lower → LL.
- Break of Structure (BOS)
A BOS is drawn when price closes (or wicks, depending on settings) beyond a previous swing.
The first BOS against trend can optionally be labelled CHoCH.
Range calculation
When a new swing is confirmed, the script prints the difference between that pivot and the previous swing.
Example: HL at 24,600 → HH at 24,655 → label shows HH (55).
Inputs & customization
Swing Length: bars left/right used to confirm pivots. Larger = fewer, more reliable swings; smaller = more signals, more noise.
BOS Confirmation: choose whether a BOS requires a full candle close or just a wick beyond the level.
Show CHoCH: toggle whether the first countertrend BOS is renamed CHoCH.
Show Swing Points: show/hide HH / LH / HL / LL labels.
BOS Style Settings: customize color, line style, and width.
How to use in practice
Trend identification:
Uptrend → repeating HL → HH sequence.
Downtrend → repeating LH → LL.
Breakout confirmation:
- A BOS confirms continuation. Retests of BOS lines often act as support/resistance.
Reversal watch:
- A CHoCH can signal possible trend shift. Wait for confirmation from price action or higher timeframe structure.
Range analysis:
- The range numbers help compare move sizes. If swings shrink, market may be consolidating; if they expand, volatility is rising.
Best practices
- Combine with higher timeframe analysis: use HTF trend, then refine entries on LTF.
- Always confirm with other tools (volume, RSI, order flow) before trading.
- Adjust Swing Length for the symbol and timeframe you trade.
- Use risk management — never rely on a single indicator.
Technical notes
- Pivots are not predictive — they appear only after confirmation. This avoids repainting but introduces lag.
- Many labels/lines can impact chart performance; the script sets sensible max_labels_count and max_lines_count.
- Designed for clarity, not signals. It does not issue buy/sell calls.
Disclaimer
This script is for educational purposes only. It is not financial advice and should not be used as a sole basis for trading decisions. Past performance of any method or indicator does not guarantee future results. Always test on demo accounts and apply proper risk management.
開源腳本
本著TradingView的真正精神,此腳本的創建者將其開源,以便交易者可以查看和驗證其功能。向作者致敬!雖然您可以免費使用它,但請記住,重新發佈程式碼必須遵守我們的網站規則。
I am nothing @shunya.trade
免責聲明
這些資訊和出版物並不意味著也不構成TradingView提供或認可的金融、投資、交易或其他類型的意見或建議。請在使用條款閱讀更多資訊。
開源腳本
本著TradingView的真正精神,此腳本的創建者將其開源,以便交易者可以查看和驗證其功能。向作者致敬!雖然您可以免費使用它,但請記住,重新發佈程式碼必須遵守我們的網站規則。
I am nothing @shunya.trade
免責聲明
這些資訊和出版物並不意味著也不構成TradingView提供或認可的金融、投資、交易或其他類型的意見或建議。請在使用條款閱讀更多資訊。