OPEN-SOURCE SCRIPT
已更新 Auto Fractal [theUltimator5]
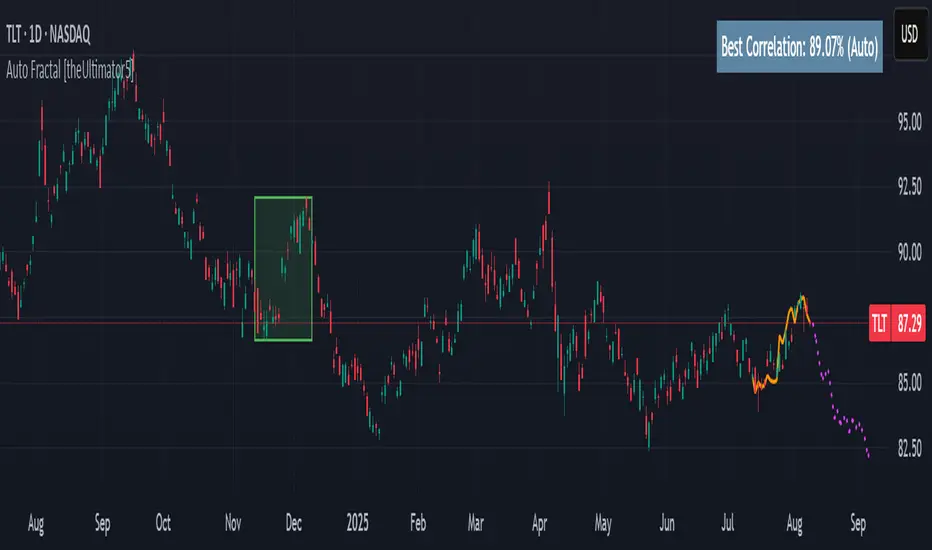
This indicator is what I call the Auto Fractal. It is a unique algorithm that looks back in time, finds a segment on the chart that closest matches the recent price action, then projects the price forwards. It effectively finds chart patterns and shows you what the price did the last time the same/similar chart pattern was observed.
Creating an algorithm to match abstract curves to other abstract curves and provide a confidence score was the fundamental problem that needed to be solved in order to create this indicator, which curve matches with surprising accuracy.
The most effective method to "curve match" that I found is the Pearson Coefficient, set by a segment length and a lookback period. After the highest coefficient curve is located, the curve then gets scaled and offset to match the current price.
The past segment is drawn over the current price (orange line), giving a visualization of the two curves and how closely they match each other. The indicator then projects the price forwards in time based on the price action of the chart from the historical segment (dashed fuchsia line).
A bounding box also gets drawn around the historical segment to give you a clear visual of where the price is getting pulled from for proper analysis and ease of use.
The Pearson Coefficient % is shown in a table in the top right-hand corner of the chart and can be toggled off if desired. The values range from -100% (perfectly inverse correlation) to +100% (perfectly correlated) with 0 meaning no correlation whatsoever. The closer to +100% the value is, the better the segment match.
As with most/all of my indicators, user interface and simplicity was at the top of my priority list. I designed this to be easily readable and intuitive to both novice and veteran traders, without cluttering the chart.
Note:
This indicator is extremely heavy in terms of memory usage due to nested for loops, and takes several seconds to initially load the chart overlay. If the lookback period is increased too high (>600) then the indicator may time out and fail to load anything. If nothing loads on the chart, try reducing the lookback length and wait up to 10 seconds for lines to appear.
發行說明
I added a color gradient to the correlation table to give a quick view of correlation strength.When the correlation is 100%, the table is blue.
When the correlation is 70% or below, the table is orange.
The table color changes based on a gradient between 100% and 70%. The more "blue" the table is, the stronger the correlation.
This is the first of several planned additional features.
發行說明
Several quality of life updates from popular demand...1) I added the option to change the colors of both the match line segment (originally orange) and the future projection line segment (originally fuchsia)
2) I added a checkbox to "FREEZE" the projection line, which stops the projection line from updating. The use for this is if you want to see if the price actually follows the projection.
I still plan on implementing a historical back test option to let you choose a specific setup and see if that setup is repeatable. This functionality is still in the works and will be pushed out in a later update.
I want to thank Mr-FD for help on the freeze functionality. That was a huge win.
發行說明
I added a new user input to set a minimum correlation threshold. The script will stop looking for a better fractal if it finds a match greater than the minimum threshold.The value can be between 0 (no correlation) and 1 (perfect correlation)
The default value is set at 0.95 to ensure strict matching criteria.
If the script takes too long to load, lowering the default value can speed up time to find a match.
發行說明
I updated the green box around the historical matched segment to properly bound the min and max values發行說明
I added a manual mode that allows you to select a point in time to check for a fractal. This allows you to backtest fractal patterns.I also added a note on the correlation table to state whether you are in manual mode or not, as well as how many bars back the manual position is set at.
發行說明
Cleanup - I removed the freeze plot checkbox since it was obsoleted by the manual point selection.
I also corrected manual point selection to not be required for the initial projection even when the checkbox is ticked off.
發行說明
I added a selection that lets you choose among the following options:Auto Fractal (default, looks for best fit)
MOASS (looks for most bullish possible segment)
BBBYQ (looks for most bearish possible segment)
Plots updated respectively. This was added to be an amusing option
發行說明
Updated the chart to show active indicator and timeframe properly per house rules.開源腳本
秉持TradingView一貫精神,這個腳本的創作者將其設為開源,以便交易者檢視並驗證其功能。向作者致敬!您可以免費使用此腳本,但請注意,重新發佈代碼需遵守我們的社群規範。
免責聲明
這些資訊和出版物並非旨在提供,也不構成TradingView提供或認可的任何形式的財務、投資、交易或其他類型的建議或推薦。請閱讀使用條款以了解更多資訊。
開源腳本
秉持TradingView一貫精神,這個腳本的創作者將其設為開源,以便交易者檢視並驗證其功能。向作者致敬!您可以免費使用此腳本,但請注意,重新發佈代碼需遵守我們的社群規範。
免責聲明
這些資訊和出版物並非旨在提供,也不構成TradingView提供或認可的任何形式的財務、投資、交易或其他類型的建議或推薦。請閱讀使用條款以了解更多資訊。