OPEN-SOURCE SCRIPT
已更新 SAR Pullback By TradingConToto
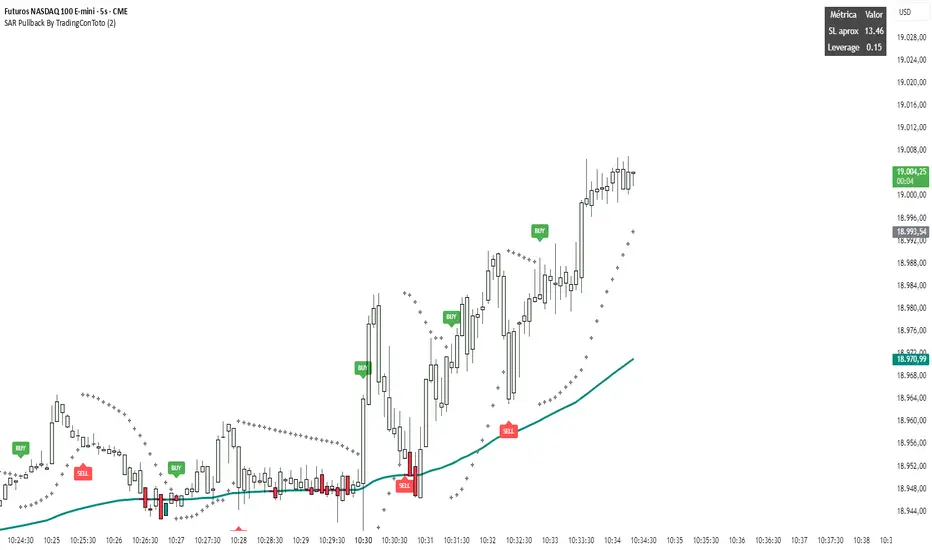
Name & Version
SAR Pullback UX Improved (Pine Script v5)
Core Logic
Calculates two EMAs (fast and slow) to identify overall trend direction.
Uses the Parabolic SAR to detect “flip” points (when SAR crosses price), marking micro-trend reversals.
Micro-Trend Extremes
Tracks the highest high after a bullish flip (SAR below price) and the lowest low after a bearish flip (SAR above price).
These extremes feed into the stop-loss approximation.
Approximate Stop-Loss (“SL aprox”)
If SAR is below price (bullish), SL ≔ (micro-trend high − current SAR).
If SAR is above price (bearish), SL ≔ (current SAR − micro-trend low).
Leverage Calculation
User-defined “UR in USD” input.
Computes leverage as UR ÷ SL, giving you an estimate of position sizing potential.
On-Chart Signals
BUY label at each bullish flip, with SL and leverage printed.
SELL label at each bearish flip, likewise showing SL and leverage.
Customizable UI
Inputs to toggle display of SL, leverage, or both.
Choose your UR value, panel background/text colors, and BUY/SELL label colors.
Panel position fixed at top-right by default, showing a 2×3 table:
Header row (“Metric” / “Value”)
“SL aprox” row
“Leverage” row
Visuals
Plots the slow EMA colored by trend.
Draws SAR as crosses.
Bar colors shade green/red according to bullish/bearish conditions.
Semi-transparent, styled panel for quick glance of key metrics.
This indicator combines trend filtering, automated stop-loss sizing, and leverage guidance into a single, fully-configurable Pine Script tool—giving you clear on-chart signals plus a neat metrics panel for streamlined decision-making.
發行說明
Update maths發行說明
Update bad math開源腳本
秉持TradingView一貫精神,這個腳本的創作者將其設為開源,以便交易者檢視並驗證其功能。向作者致敬!您可以免費使用此腳本,但請注意,重新發佈代碼需遵守我們的社群規範。
免責聲明
這些資訊和出版物並非旨在提供,也不構成TradingView提供或認可的任何形式的財務、投資、交易或其他類型的建議或推薦。請閱讀使用條款以了解更多資訊。
開源腳本
秉持TradingView一貫精神,這個腳本的創作者將其設為開源,以便交易者檢視並驗證其功能。向作者致敬!您可以免費使用此腳本,但請注意,重新發佈代碼需遵守我們的社群規範。
免責聲明
這些資訊和出版物並非旨在提供,也不構成TradingView提供或認可的任何形式的財務、投資、交易或其他類型的建議或推薦。請閱讀使用條款以了解更多資訊。