OPEN-SOURCE SCRIPT
已更新 Seasonality and Presidential cycle
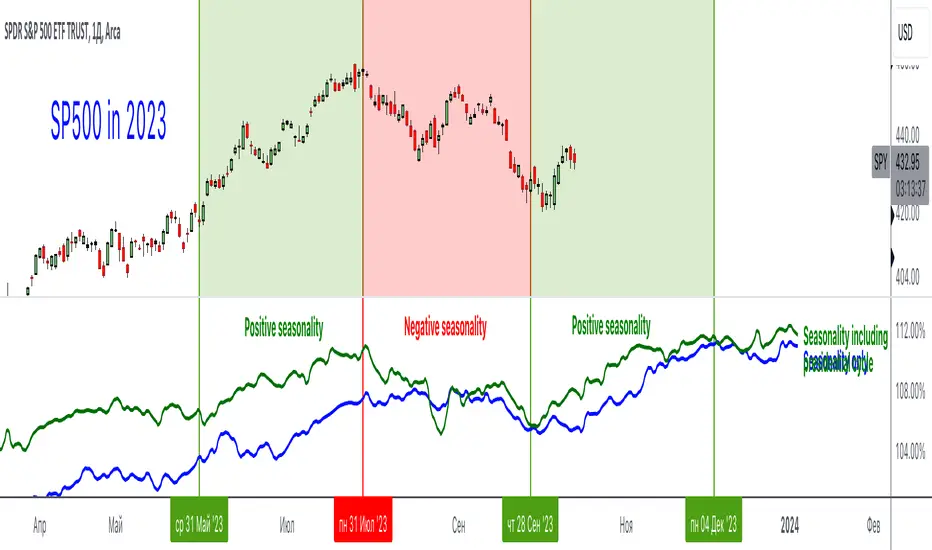
An incredibly useful indicator that shows seasonality and presidential cycles by indices, stocks and industries. Just type in a ticker and trade according to seasonal patterns
Blue line - seasonality excluding presidential cycles
Green line - seasonality taking into account presidential cycles
*Seasonal patterns over the last 10 years
This indicator uses the request.seed() function.
Requests data from a GitHub repository maintained by our team and returns it as a series.
Pine Seeds is a service to import custom data and access it via TradingView.
Use TradingView as frontend and use a GitHub repository as backend.
github.com/tradingview-pine-seeds/docs
...
Rus: Невероятно полезный индикатор, который показывает сезонность и президентские циклы по индексам, акциям и отраслям. Просто вбейте тикер и торгуйте согласно сезонным паттернам
Синяя линия - сезонность без учета президентских циклов
Зеленая линия - сезонность с учетом президентских циклов
*Сезонные паттерны за последние 10 лет
發行說明
New demo chart發行說明
New chart發行說明
New chart發行說明
New chart發行說明
New chart發行說明
New chart發行說明
New chart發行說明
New chart, some bugs fixed發行說明
New chart發行說明
Bugs fixed發行說明
New code發行說明
Data for 2024 發行說明
More tickers發行說明
Monthly seasonality發行說明
Seasonal patterns (new)發行說明
Bugs fixed發行說明
Seasonality and Presidential cycle for 2025發行說明
Optimized and improved loading speed開源腳本
秉持TradingView一貫精神,這個腳本的創作者將其設為開源,以便交易者檢視並驗證其功能。向作者致敬!您可以免費使用此腳本,但請注意,重新發佈代碼需遵守我們的社群規範。
免責聲明
這些資訊和出版物並非旨在提供,也不構成TradingView提供或認可的任何形式的財務、投資、交易或其他類型的建議或推薦。請閱讀使用條款以了解更多資訊。
開源腳本
秉持TradingView一貫精神,這個腳本的創作者將其設為開源,以便交易者檢視並驗證其功能。向作者致敬!您可以免費使用此腳本,但請注意,重新發佈代碼需遵守我們的社群規範。
免責聲明
這些資訊和出版物並非旨在提供,也不構成TradingView提供或認可的任何形式的財務、投資、交易或其他類型的建議或推薦。請閱讀使用條款以了解更多資訊。