OPEN-SOURCE SCRIPT
Inside Bars
Inside Bars Indicator
Description:
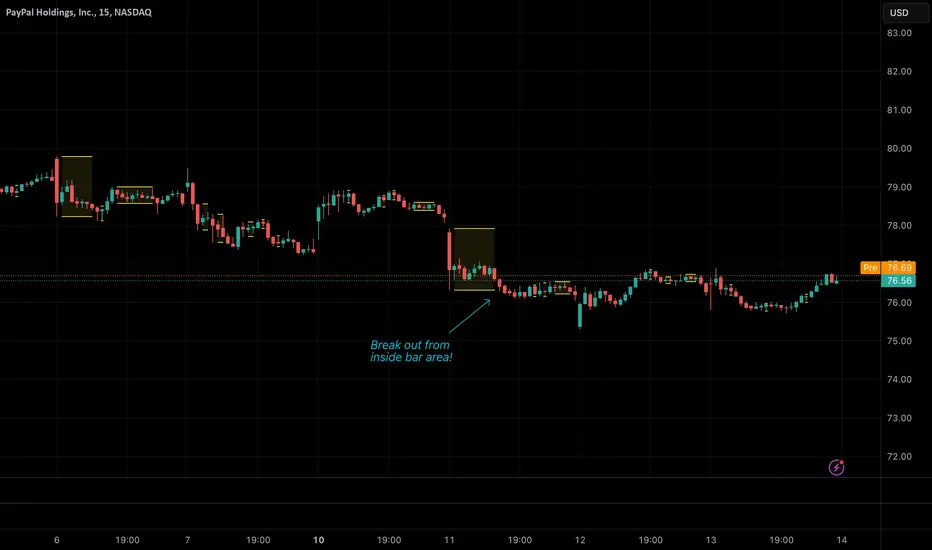
This indicator identifies and highlights price action patterns where a bar's high and low
are completely contained within the previous bar's range. Inside bars are significant
technical patterns that often signal a period of price consolidation or uncertainty,
potentially leading to a breakout in either direction.
Trading Literature & Theory:
Inside bars are well-documented in technical analysis literature:
- Steve Nison discusses them in "Japanese Candlestick Charting Techniques" as a form
of harami pattern, indicating potential trend reversals
- Thomas Bulkowski's "Encyclopedia of Chart Patterns" categorizes inside bars as
a consolidation pattern with statistical significance for breakout trading
- Alexander Elder references them in "Trading for a Living" as indicators of
decreasing volatility and potential energy build-up
- John Murphy's "Technical Analysis of the Financial Markets" includes inside bars
as part of price action analysis for market psychology understanding
The pattern is particularly significant because it represents:
1. Volatility Contraction: A narrowing of price range indicating potential energy build-up
2. Institutional Activity: Often shows large players absorbing or distributing positions
3. Decision Point: Market participants evaluating the previous bar's significance
Trading Applications:
1. Breakout Trading
- Watch for breaks above the parent bar's high (bullish signal)
- Monitor breaks below the parent bar's low (bearish signal)
- Multiple consecutive inside bars can indicate stronger breakout potential
2. Market Psychology
- Inside bars represent a period of equilibrium between buyers and sellers
- Shows market uncertainty and potential energy building up
- Often precedes significant price movements
Best Market Conditions:
- Trending markets approaching potential reversal points
- After strong momentum moves where the market needs to digest gains
- Near key support/resistance levels
- During pre-breakout consolidation phases
Complementary Indicators:
- Volume indicators to confirm breakout strength
- Trend indicators (Moving Averages, ADX) for context
- Momentum indicators (RSI, MACD) for additional confirmation
Risk Management:
- Use parent bar's range for stop loss placement
- Wait for breakout confirmation before entry
- Consider time-based exits if breakout doesn't occur
- More reliable on higher timeframes
Note: The indicator works best when combined with proper risk management
and overall market context analysis. Avoid trading every inside bar pattern
and always confirm with volume and other technical indicators.
Description:
This indicator identifies and highlights price action patterns where a bar's high and low
are completely contained within the previous bar's range. Inside bars are significant
technical patterns that often signal a period of price consolidation or uncertainty,
potentially leading to a breakout in either direction.
Trading Literature & Theory:
Inside bars are well-documented in technical analysis literature:
- Steve Nison discusses them in "Japanese Candlestick Charting Techniques" as a form
of harami pattern, indicating potential trend reversals
- Thomas Bulkowski's "Encyclopedia of Chart Patterns" categorizes inside bars as
a consolidation pattern with statistical significance for breakout trading
- Alexander Elder references them in "Trading for a Living" as indicators of
decreasing volatility and potential energy build-up
- John Murphy's "Technical Analysis of the Financial Markets" includes inside bars
as part of price action analysis for market psychology understanding
The pattern is particularly significant because it represents:
1. Volatility Contraction: A narrowing of price range indicating potential energy build-up
2. Institutional Activity: Often shows large players absorbing or distributing positions
3. Decision Point: Market participants evaluating the previous bar's significance
Trading Applications:
1. Breakout Trading
- Watch for breaks above the parent bar's high (bullish signal)
- Monitor breaks below the parent bar's low (bearish signal)
- Multiple consecutive inside bars can indicate stronger breakout potential
2. Market Psychology
- Inside bars represent a period of equilibrium between buyers and sellers
- Shows market uncertainty and potential energy building up
- Often precedes significant price movements
Best Market Conditions:
- Trending markets approaching potential reversal points
- After strong momentum moves where the market needs to digest gains
- Near key support/resistance levels
- During pre-breakout consolidation phases
Complementary Indicators:
- Volume indicators to confirm breakout strength
- Trend indicators (Moving Averages, ADX) for context
- Momentum indicators (RSI, MACD) for additional confirmation
Risk Management:
- Use parent bar's range for stop loss placement
- Wait for breakout confirmation before entry
- Consider time-based exits if breakout doesn't occur
- More reliable on higher timeframes
Note: The indicator works best when combined with proper risk management
and overall market context analysis. Avoid trading every inside bar pattern
and always confirm with volume and other technical indicators.
開源腳本
秉持TradingView一貫精神,這個腳本的創作者將其設為開源,以便交易者檢視並驗證其功能。向作者致敬!您可以免費使用此腳本,但請注意,重新發佈代碼需遵守我們的社群規範。
免責聲明
這些資訊和出版物並非旨在提供,也不構成TradingView提供或認可的任何形式的財務、投資、交易或其他類型的建議或推薦。請閱讀使用條款以了解更多資訊。
免責聲明
這些資訊和出版物並非旨在提供,也不構成TradingView提供或認可的任何形式的財務、投資、交易或其他類型的建議或推薦。請閱讀使用條款以了解更多資訊。