INVITE-ONLY SCRIPT
已更新 Multi Time Frame - Trade Setups
Muti Time Frame - Trade Setups
How does it work ? Price movements over range of period is used to compute the range moving forward.
As the option for wider time periods are selected more candles are selected for calculation
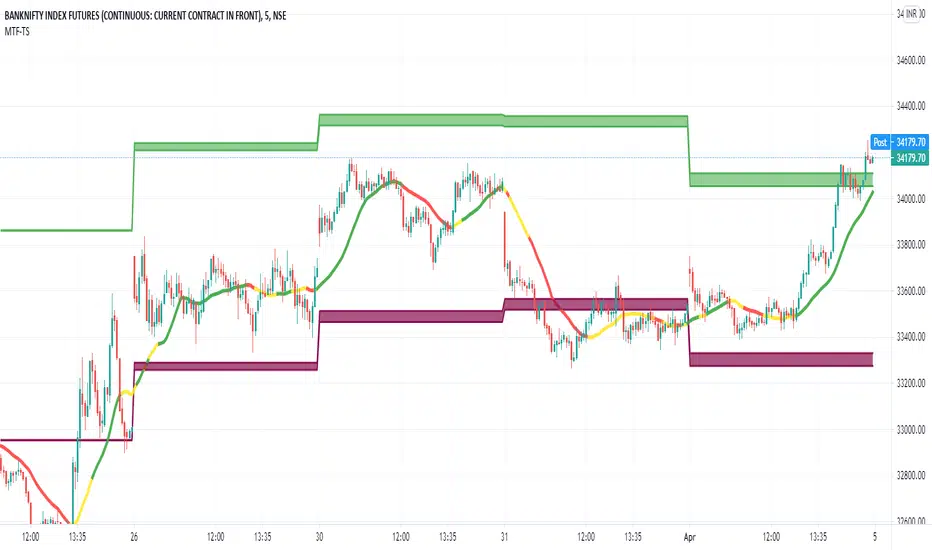
The Trend Line is the supporting factor to this logic and SMA20 is used as the basis of the trend line.
To Indicate the strength of the trend line , RSI is computed over multiple timeframes and then used to colour the trend line to show its strength
Once the Range is identified it can be considered as the Breakout/Breakdown zones or as the Potential Reversal Zones (PRZ)
How to Deploy / Use
As part of the Indicator there are four Choices that the user can opt for
Show Intraday Trades - This works for Intraday Trades - when the resolution is kept to less than 1 hour ( Say 3 , 5 , 10 , 15 Mins)
Show Short Term Trades - This works well when the resolution is kept to 1 Day - Good for Swing Trades spanning over a few days
Show Long Term Trades - This works well when the resolution is kept to 1 Day or Week - Good for Investments
Show Trend Line - Will show the user the Simple Moving Average 20 based on the resolution selected , The Trend Line Is a repainted based on the hybrid RSI Logic
The Trend Line would show in three colours
Green : The Setup is in Up Trend- Try to take the trade as closer to the band as possible and when it continues to be in green ( and recommended when it would have just crossed from Red/Yellow to Green )
Red : The Setup is in Down Trend - Try to take the trade as closer to the band as possible and when it continues to be in red ( and recommended when it would have just crossed from Green/Yellow to Red )
Yellow : The Setup in sideways Trend ( a new trade isnt recommend in this band
Visual Checks - It is always recommended to enter/exit the trade it it touches crosses over the Trend Line from one side to the other
When closer to the support resistance bands , wait for a confirmation candle to determine if you are getting resistance breakout / support or breakdown
Stop Loss - That should be done by following ones risk appetite , Ideally the open/close of the previous candle should be the stop loss for the buy/sell
but everyone has their own Risk Management Strategies based on the capital deployed.
Usage/Markets : Index Trading / Equities and on proper analysis you may use it for Option Trading also. - Doesnt work that well with Commodities and Currencies
Disclaimer : There could be scenarios when the breakout/breakdown candle is rejected , especially when it is long one
so it is always recommended to have a confirmation candle that open-closes above the breakout candle / open-closes below the breakdown candle
If you like it and find it useful or if you find a defect or bug , Please let us know in the comments .. that would encouraging !! for us to develop it further
Thank you and have a beautiful and Profitable trading session !
How to get access
Please click on the link / email in the signature or send me a private message to get access
Feedback
Please click on the link/email in the signature or send me a private message for suggestions/feedbacks
How does it work ? Price movements over range of period is used to compute the range moving forward.
As the option for wider time periods are selected more candles are selected for calculation
The Trend Line is the supporting factor to this logic and SMA20 is used as the basis of the trend line.
To Indicate the strength of the trend line , RSI is computed over multiple timeframes and then used to colour the trend line to show its strength
Once the Range is identified it can be considered as the Breakout/Breakdown zones or as the Potential Reversal Zones (PRZ)
How to Deploy / Use
As part of the Indicator there are four Choices that the user can opt for
Show Intraday Trades - This works for Intraday Trades - when the resolution is kept to less than 1 hour ( Say 3 , 5 , 10 , 15 Mins)
Show Short Term Trades - This works well when the resolution is kept to 1 Day - Good for Swing Trades spanning over a few days
Show Long Term Trades - This works well when the resolution is kept to 1 Day or Week - Good for Investments
Show Trend Line - Will show the user the Simple Moving Average 20 based on the resolution selected , The Trend Line Is a repainted based on the hybrid RSI Logic
The Trend Line would show in three colours
Green : The Setup is in Up Trend- Try to take the trade as closer to the band as possible and when it continues to be in green ( and recommended when it would have just crossed from Red/Yellow to Green )
Red : The Setup is in Down Trend - Try to take the trade as closer to the band as possible and when it continues to be in red ( and recommended when it would have just crossed from Green/Yellow to Red )
Yellow : The Setup in sideways Trend ( a new trade isnt recommend in this band
Visual Checks - It is always recommended to enter/exit the trade it it touches crosses over the Trend Line from one side to the other
When closer to the support resistance bands , wait for a confirmation candle to determine if you are getting resistance breakout / support or breakdown
Stop Loss - That should be done by following ones risk appetite , Ideally the open/close of the previous candle should be the stop loss for the buy/sell
but everyone has their own Risk Management Strategies based on the capital deployed.
Usage/Markets : Index Trading / Equities and on proper analysis you may use it for Option Trading also. - Doesnt work that well with Commodities and Currencies
Disclaimer : There could be scenarios when the breakout/breakdown candle is rejected , especially when it is long one
so it is always recommended to have a confirmation candle that open-closes above the breakout candle / open-closes below the breakdown candle
If you like it and find it useful or if you find a defect or bug , Please let us know in the comments .. that would encouraging !! for us to develop it further
Thank you and have a beautiful and Profitable trading session !
How to get access
Please click on the link / email in the signature or send me a private message to get access
Feedback
Please click on the link/email in the signature or send me a private message for suggestions/feedbacks
發行說明
Update Date Ranges , Cosmetic Fixes. 發行說明
Additional Options :with the update the daily levels would be not connected to the previous day and when the user would select show short or long term TF ..
The short term support and long term support would now be available only for current week which again add to the screen space for the users
the user would have option to show support level or not .. This is used to give additional screen space to uses
發行說明
Cosmetic Updates僅限邀請腳本
僅作者批准的使用者才能訪問此腳本。您需要申請並獲得使用許可,通常需在付款後才能取得。更多詳情,請依照作者以下的指示操作,或直接聯絡PortfolioBuddy。
TradingView不建議在未完全信任作者並了解其運作方式的情況下購買或使用腳本。您也可以在我們的社群腳本中找到免費的開源替代方案。
作者的說明
with the update the daily levels would be not connected to the previous day and when the user would select show short or long term TF ..
Email : portfoliobuddyts@gmail.com
免責聲明
這些資訊和出版物並非旨在提供,也不構成TradingView提供或認可的任何形式的財務、投資、交易或其他類型的建議或推薦。請閱讀使用條款以了解更多資訊。
僅限邀請腳本
僅作者批准的使用者才能訪問此腳本。您需要申請並獲得使用許可,通常需在付款後才能取得。更多詳情,請依照作者以下的指示操作,或直接聯絡PortfolioBuddy。
TradingView不建議在未完全信任作者並了解其運作方式的情況下購買或使用腳本。您也可以在我們的社群腳本中找到免費的開源替代方案。
作者的說明
with the update the daily levels would be not connected to the previous day and when the user would select show short or long term TF ..
Email : portfoliobuddyts@gmail.com
免責聲明
這些資訊和出版物並非旨在提供,也不構成TradingView提供或認可的任何形式的財務、投資、交易或其他類型的建議或推薦。請閱讀使用條款以了解更多資訊。