OPEN-SOURCE SCRIPT
已更新 Santa's Adventure [AlgoAlpha]

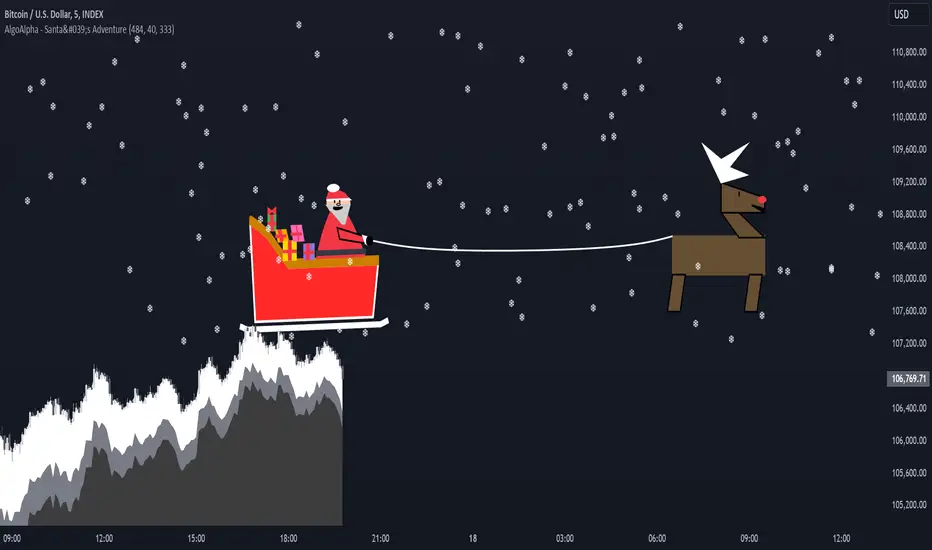
Introducing "Santa's Adventure," a unique and festive TradingView indicator designed to bring the holiday spirit to your trading charts. With this indicator, watch as Santa, his sleigh, Rudolf the reindeer, and a flurry of snowflakes come to life, creating a cheerful visual experience while you monitor the markets.
Key Features:
🎁 Dynamic Santa Sleigh Visualization: Santa's sleigh, Rudolf, and holiday presents adapt to price movements and chart structure.
🎨 Customizable Holiday Colors: Adjust colors for Santa’s outfit, Rudolf’s nose, sleigh, presents, and more.
❄️ Realistic Snow Animation: A cascade of snowflakes decorates your charts, with density and range adjustable to suit your preferences.
📏 Adaptive Scaling: All visuals scale based on price volatility and market dynamics.
🔄 Rotation by Trend: Santa and his entourage tilt to reflect market trends, making it both functional and fun!
How to Use:
Add the Indicator to Your Chart: Search for "Santa's Adventure" in the TradingView indicator library and add it to your favorites. Use the input menu to adjust snow density, sleigh colors, and other festive elements to match your trading style or holiday mood.

Observe the Market: Watch Santa’s sleigh glide across the chart while Rudolf leads the way, with snowflakes gently falling to enhance the visual charm.


How It Works:
The indicator uses price volatility and market data to dynamically position Santa, his sleigh, Rudolf, and presents on the chart. Santa's Sleigh angle adjusts based on price trends, reflecting market direction. Santa's sleigh and the snowstorm are plotted using advanced polyline arrays for a smooth and interactive display. A festive algorithm powers the snowfall animation, ensuring a consistent and immersive holiday atmosphere. The visuals are built to adapt seamlessly to any market environment, combining holiday cheer with market insights.
Add "Santa's Adventure" to your TradingView charts today and bring the holiday spirit to your trading journey, Merry Christmas! 🎅🎄
Key Features:
🎁 Dynamic Santa Sleigh Visualization: Santa's sleigh, Rudolf, and holiday presents adapt to price movements and chart structure.
🎨 Customizable Holiday Colors: Adjust colors for Santa’s outfit, Rudolf’s nose, sleigh, presents, and more.
❄️ Realistic Snow Animation: A cascade of snowflakes decorates your charts, with density and range adjustable to suit your preferences.
📏 Adaptive Scaling: All visuals scale based on price volatility and market dynamics.
🔄 Rotation by Trend: Santa and his entourage tilt to reflect market trends, making it both functional and fun!
How to Use:
Add the Indicator to Your Chart: Search for "Santa's Adventure" in the TradingView indicator library and add it to your favorites. Use the input menu to adjust snow density, sleigh colors, and other festive elements to match your trading style or holiday mood.
Observe the Market: Watch Santa’s sleigh glide across the chart while Rudolf leads the way, with snowflakes gently falling to enhance the visual charm.
How It Works:
The indicator uses price volatility and market data to dynamically position Santa, his sleigh, Rudolf, and presents on the chart. Santa's Sleigh angle adjusts based on price trends, reflecting market direction. Santa's sleigh and the snowstorm are plotted using advanced polyline arrays for a smooth and interactive display. A festive algorithm powers the snowfall animation, ensuring a consistent and immersive holiday atmosphere. The visuals are built to adapt seamlessly to any market environment, combining holiday cheer with market insights.
Add "Santa's Adventure" to your TradingView charts today and bring the holiday spirit to your trading journey, Merry Christmas! 🎅🎄
發行說明
Made Present 1 green發行說明
Changed inputs發行說明
Updated Chart with updated presents.發行說明
small changes開源腳本
秉持TradingView一貫精神,這個腳本的創作者將其設為開源,以便交易者檢視並驗證其功能。向作者致敬!您可以免費使用此腳本,但請注意,重新發佈代碼需遵守我們的社群規範。
🚨Get premium for 50% OFF (ends Jan 31st): algoalpha.io
🛜Get FREE signals: discord.gg/xCmqTVRexz
💡Tutorials: youtube.com/@AlgoAlpha
🛜Get FREE signals: discord.gg/xCmqTVRexz
💡Tutorials: youtube.com/@AlgoAlpha
免責聲明
這些資訊和出版物並非旨在提供,也不構成TradingView提供或認可的任何形式的財務、投資、交易或其他類型的建議或推薦。請閱讀使用條款以了解更多資訊。
開源腳本
秉持TradingView一貫精神,這個腳本的創作者將其設為開源,以便交易者檢視並驗證其功能。向作者致敬!您可以免費使用此腳本,但請注意,重新發佈代碼需遵守我們的社群規範。
🚨Get premium for 50% OFF (ends Jan 31st): algoalpha.io
🛜Get FREE signals: discord.gg/xCmqTVRexz
💡Tutorials: youtube.com/@AlgoAlpha
🛜Get FREE signals: discord.gg/xCmqTVRexz
💡Tutorials: youtube.com/@AlgoAlpha
免責聲明
這些資訊和出版物並非旨在提供,也不構成TradingView提供或認可的任何形式的財務、投資、交易或其他類型的建議或推薦。請閱讀使用條款以了解更多資訊。