OPEN-SOURCE SCRIPT
已更新 Earnings [theUltimator5]
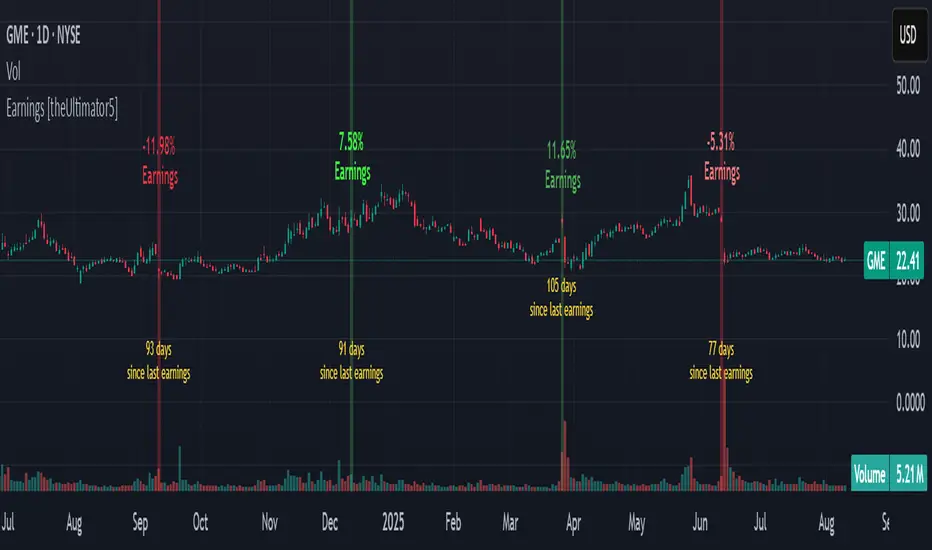
This indicator highlights daily price changes on earnings announcement days using dynamic colors, labels, and optional earnings markers.
🔍 Key Features:
Earnings Detection:
Price Change Calculation:
Color-coded Labels:
Color intensity reflects the size and direction of the move:
Optional "Earnings" Marker:
Background Highlight:
⚙️ User Input:
✅ Show 'E' Marker: Toggles the visibility of the "Earnings" label below the main price change label.
✅ Ideal Use Case:
Use this indicator to visually analyze how a stock reacts on earnings days, helping traders spot consistent behavior patterns (e.g., post-earnings rallies or selloffs).
🔍 Key Features:
Earnings Detection:
- Highlights only the days when an earnings event occurs.
Price Change Calculation:
- Computes the percentage change from open to close on earnings day.
Color-coded Labels:
- Displays the % change as a floating label above the chart on earnings days.
Color intensity reflects the size and direction of the move:
- Bright green for large gains (≥ +10%)
- Bright red for large losses (≤ -10%)
- White for negligible change
- Gradient fades between those extremes
Optional "Earnings" Marker:
- A small label marked “Earnings” appears beneath the % change label, controlled by a user toggle.
Background Highlight:
- The chart background is shaded on earnings days with a semi-transparent color based on the % change.
⚙️ User Input:
✅ Show 'E' Marker: Toggles the visibility of the "Earnings" label below the main price change label.
✅ Ideal Use Case:
Use this indicator to visually analyze how a stock reacts on earnings days, helping traders spot consistent behavior patterns (e.g., post-earnings rallies or selloffs).
發行說明
Added number of days since last earnings at bottom of chart.Removed option for showing "E" for earnings, and change it to simply be below the price change.
Added user select to show days since last earnings.
發行說明
I updated the calculation for earnings day percent change. Precious one was incorrect. I also slightly modified how the labels are positioned since they would easily be out of bounds, especially if viewed on mobile. Instead of using a 200 day high/low to create the labels, I now use a 5 day high/low發行說明
Updated chart to show indicator name in order to abide by house rules.開源腳本
秉持TradingView一貫精神,這個腳本的創作者將其設為開源,以便交易者檢視並驗證其功能。向作者致敬!您可以免費使用此腳本,但請注意,重新發佈代碼需遵守我們的社群規範。
免責聲明
這些資訊和出版物並非旨在提供,也不構成TradingView提供或認可的任何形式的財務、投資、交易或其他類型的建議或推薦。請閱讀使用條款以了解更多資訊。
開源腳本
秉持TradingView一貫精神,這個腳本的創作者將其設為開源,以便交易者檢視並驗證其功能。向作者致敬!您可以免費使用此腳本,但請注意,重新發佈代碼需遵守我們的社群規範。
免責聲明
這些資訊和出版物並非旨在提供,也不構成TradingView提供或認可的任何形式的財務、投資、交易或其他類型的建議或推薦。請閱讀使用條款以了解更多資訊。