OPEN-SOURCE SCRIPT
已更新 Supply In Profit Z-Score | Wave Background
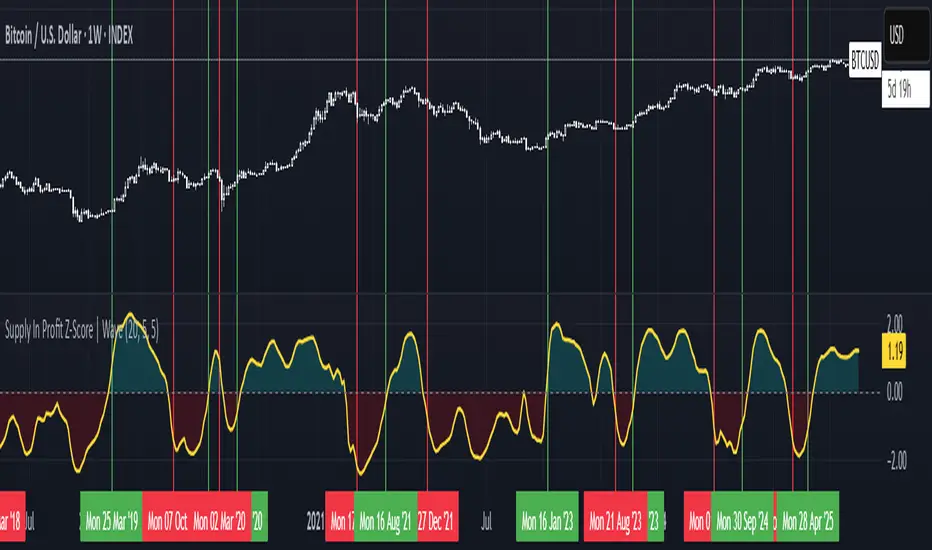
Supply in Profit Z-Score
Modified by Quant_Hustler | Original by QuantChook
What it does
The Supply in Profit Z-Score measures how extreme the balance is between BTC addresses in profit versus those in loss compared to historical norms.
It highlights periods of excessive optimism or pessimism, helping traders identify market sentiment extremes that can signal potential turning points or confirm ongoing trends.
This version is designed for longer-term strategies, using smoothing and statistical normalization to focus on broader market sentiment cycles rather than short-term noise.
How it works
--Data Retrieval: Pulls on-chain data showing the percentage of Bitcoin addresses currently in profit and in loss.
--Spread Calculation: Finds the difference between the two to gauge overall sentiment balance.
--Alpha Decay Adjustment (optional): Normalizes extreme values to stabilize the signal over time.
--Smoothing: Applies a moving average to filter daily volatility and improve long-term clarity.
--Z-Score Conversion: Standardizes the data to show how far current sentiment deviates from historical averages.
--Visualization: Plots the result around a neutral midpoint (zero line) — positive values indicate profit dominance, negative values indicate loss dominance.
How to use it
--Above Zero: More addresses in profit → bullish sentiment and strong trend conditions.
--Below Zero: More addresses in loss → bearish sentiment or potential accumulation zones.
--Extreme Values: Mark overly optimistic or capitulated sentiment, often preceding major reversals.
Why use it in trend following
--This indicator serves as an on-chain sentiment confirmation layer for trend-following systems, especially on higher timeframes (daily or weekly).
--In uptrends, sustained positive readings confirm market strength and investor confidence.
--In downtrends, persistent negative readings confirm weakness and help avoid false reversal signals.
--Divergences between price and sentiment (e.g., rising price but weakening sentiment) often signal momentum loss or potential trend transitions.
Modifications from the original by QuantChook
Added EMA, adaptive Z-score smoothing and capping to reduce volatility and noise.
Introduced a wave-style visualization for intuitive sentiment shifts.
Improved calculation structure and upgraded for Pine Script v6 efficiency.
Tuned signal responsiveness and smoothing parameters for long-term trend accuracy.
Simplified user inputs and grouping for easier customization and integration.
In summary:
A refined, statistically grounded on-chain sentiment oscillator — originally developed by QuantChook and enhanced by Quant_Hustler — built to support long-term trend-following strategies by quantifying Bitcoin market sentiment through real-time profit and loss dynamics.
發行說明
Supply in Profit Z-ScoreModified by Quant_Hustler | Original by QuantChook
Tracks the balance between BTC addresses in profit vs. in loss to highlight extreme market sentiment. Designed for long-term strategies, it shows when the market is unusually bullish or bearish, helping spot trend strength, reversals, and cycle shifts.
How it works (calculations explained):
Pulls on-chain data for the percentage of BTC addresses in profit and in loss.
Calculates the profit-loss spread by subtracting loss percentage from profit percentage.
Optionally applies alpha decay normalization to scale extreme values relative to historical lows.
Smooths the resulting series using a moving average to reduce short-term volatility.
Converts the smoothed series into a Z-score, which shows how far current sentiment deviates from its historical average.
Plots the result around a neutral midpoint: above zero = bullish, below zero = bearish.
Usage:
Above zero: Trend continuation likely.
Below zero: Weakness or accumulation.
Extreme values: Overbought/oversold zones, possible reversals.
Modifications from original:
Adaptive Z-score smoothing and capping
Alpha decay normalization for long-term stability
Wave-style visualization for intuitive sentiment reading
Tuned smoothing and responsiveness for long-term trend tracking
Streamlined user inputs for easier customization
Summary:
A refined on-chain sentiment oscillator, enhanced for long-term trend-following, showing BTC holder conviction through profit and loss dynamics.
開源腳本
秉持TradingView一貫精神,這個腳本的創作者將其設為開源,以便交易者檢視並驗證其功能。向作者致敬!您可以免費使用此腳本,但請注意,重新發佈代碼需遵守我們的社群規範。
免責聲明
這些資訊和出版物並非旨在提供,也不構成TradingView提供或認可的任何形式的財務、投資、交易或其他類型的建議或推薦。請閱讀使用條款以了解更多資訊。
開源腳本
秉持TradingView一貫精神,這個腳本的創作者將其設為開源,以便交易者檢視並驗證其功能。向作者致敬!您可以免費使用此腳本,但請注意,重新發佈代碼需遵守我們的社群規範。
免責聲明
這些資訊和出版物並非旨在提供,也不構成TradingView提供或認可的任何形式的財務、投資、交易或其他類型的建議或推薦。請閱讀使用條款以了解更多資訊。