OPEN-SOURCE SCRIPT
已更新 Table Identifies the Price Extensively Using RSI, MA, and ATR

⬤ INDICATOR KEY

⬤ INTRODUCTION
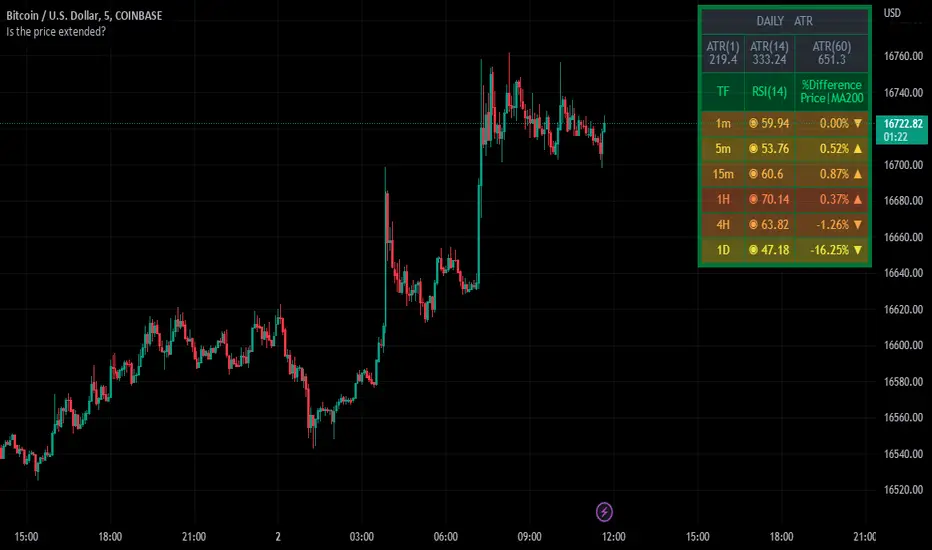
The indicator has presented as a table to show the perspective result of different indicators to help the user identify the status of the price if it’s extended or not. The table starts with the ATR section, which gives out a better look to compare the current day’s candle wide versus the average candle wide of a certain length of period that selected by the user. The second section of the table, showing RSI values at the most common upper timeframes, and the different percentages between the current price and long-term moving average entered by the user.
⬤ INDICATOR OVERVIEW

⬤ FINAL COMMENTS
▸This’s not a trading signal, but it helps to make a trading decision whether to set targets, stop loss, and enter a new trade.
▸If you found this content useful, please consider supporting presented indicators projects through PayPal which mentioned in the signature box, below.
▸ Trade Safe✌️.
⬤ OTHER GREAT INDICATORS CREATED BY MUQWISHI
📈 Muqwishi Volumetric Candle
📈 Support and Resistance For Day Trader | By MUQWISHI
⬤ INTRODUCTION
The indicator has presented as a table to show the perspective result of different indicators to help the user identify the status of the price if it’s extended or not. The table starts with the ATR section, which gives out a better look to compare the current day’s candle wide versus the average candle wide of a certain length of period that selected by the user. The second section of the table, showing RSI values at the most common upper timeframes, and the different percentages between the current price and long-term moving average entered by the user.
⬤ INDICATOR OVERVIEW
⬤ FINAL COMMENTS
▸This’s not a trading signal, but it helps to make a trading decision whether to set targets, stop loss, and enter a new trade.
▸If you found this content useful, please consider supporting presented indicators projects through PayPal which mentioned in the signature box, below.
▸ Trade Safe✌️.
⬤ OTHER GREAT INDICATORS CREATED BY MUQWISHI
📈 Muqwishi Volumetric Candle
📈 Support and Resistance For Day Trader | By MUQWISHI
開源腳本
秉持TradingView一貫精神,這個腳本的創作者將其設為開源,以便交易者檢視並驗證其功能。向作者致敬!您可以免費使用此腳本,但請注意,重新發佈代碼需遵守我們的社群規範。
Trusted Pine Programmer, For Coding Inquiries
► Website muqwishi.com/home/quotation/
► Telegram t.me/MUQWISHI
► Email service@muqwishi.com
⛾ Support My Work on “Buy Me a Coffee” buymeacoffee.com/muqwishi
► Website muqwishi.com/home/quotation/
► Telegram t.me/MUQWISHI
► Email service@muqwishi.com
⛾ Support My Work on “Buy Me a Coffee” buymeacoffee.com/muqwishi
免責聲明
這些資訊和出版物並非旨在提供,也不構成TradingView提供或認可的任何形式的財務、投資、交易或其他類型的建議或推薦。請閱讀使用條款以了解更多資訊。