OPEN-SOURCE SCRIPT
Credit Spread Monitor: HY & IG vs US10Y

📉 Credit Spread Monitor: HY & IG vs US10Y
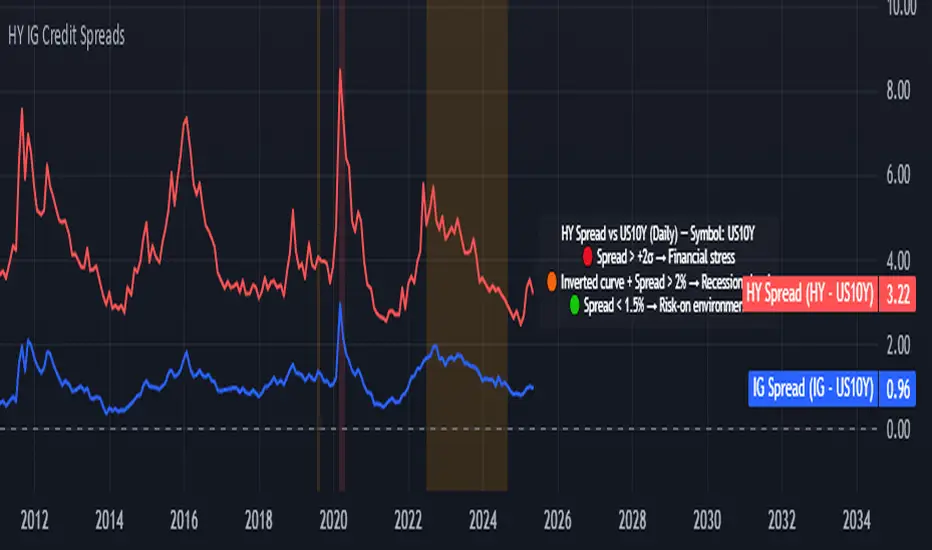
This indicator provides a dynamic and visual way to monitor credit spreads relative to the US Treasury benchmark. By comparing High Yield (HY) and Investment Grade (IG) corporate bond yields to the 10-Year US Treasury Yield (US10Y), it helps assess market stress, investor risk appetite, and potential macro turning points.
🔍 What It Does
-Calculates credit spreads:
HY Spread = BAMLH0A0HYM2EY − US10Y
IG Spread = BAMLC0A0CMEY − US10Y
-Detects macro risk regimes using statistical thresholds and yield curve signals:
🔴 HY Spread > +2σ → Potential financial stress
🟠 Inverted Yield Curve + HY Spread > 2% → Recession risk
🟢 HY Spread < 1.5% → Risk-on environment
-Visually highlights conditions with intuitive background colors for fast decision-making.
📊 Data Sources Explained
🔴 High Yield (HY): BAMLH0A0HYM2EY → ICE BofA US High Yield Index Effective Yield
🔵 Investment Grade (IG): BAMLC0A0CMEY → ICE BofA US Corporate Index Effective Yield
⚪ Treasury 10Y: US10Y → 10-Year US Treasury Yield
⚪ Treasury 2Y: US02Y → 2-Year US Treasury Yield (used to detect curve inversion)
✅ This Indicator Is Ideal For:
Macro traders looking to anticipate economic inflection points
Portfolio managers monitoring systemic risk or credit cycles
Fixed-income analysts tracking the cost of corporate borrowing
ETF/Asset allocators identifying shifts between risk-on and risk-off environments
🧠 Why It's Useful
This script helps visualize how tight or loose credit conditions are relative to government benchmarks. Since HY spreads typically widen before major downturns, this tool can provide early warning signals. Similarly, compressed spreads may indicate overheating or complacency in risk markets.
🛠️ Practical Use Case:
You’re managing a multi-asset portfolio. The HY spread jumps above +2σ while the yield curve remains inverted. You decide to reduce exposure to equities and high-yield bonds and rotate into cash or Treasuries as recession risk rises.
📎 Additional Notes
Sourced from FRED (Federal Reserve Economic Data) and TradingView’s bond feeds.
Designed to work best on daily resolution, using open prices to ensure consistency across series with different update timings.
This script is original, not based on built-in or public templates, and intended to offer educational, statistical, and visual insights for serious market participants.
開源腳本
秉持TradingView一貫精神,這個腳本的創作者將其設為開源,以便交易者檢視並驗證其功能。向作者致敬!您可以免費使用此腳本,但請注意,重新發佈代碼需遵守我們的社群規範。
免責聲明
這些資訊和出版物並非旨在提供,也不構成TradingView提供或認可的任何形式的財務、投資、交易或其他類型的建議或推薦。請閱讀使用條款以了解更多資訊。
開源腳本
秉持TradingView一貫精神,這個腳本的創作者將其設為開源,以便交易者檢視並驗證其功能。向作者致敬!您可以免費使用此腳本,但請注意,重新發佈代碼需遵守我們的社群規範。
免責聲明
這些資訊和出版物並非旨在提供,也不構成TradingView提供或認可的任何形式的財務、投資、交易或其他類型的建議或推薦。請閱讀使用條款以了解更多資訊。